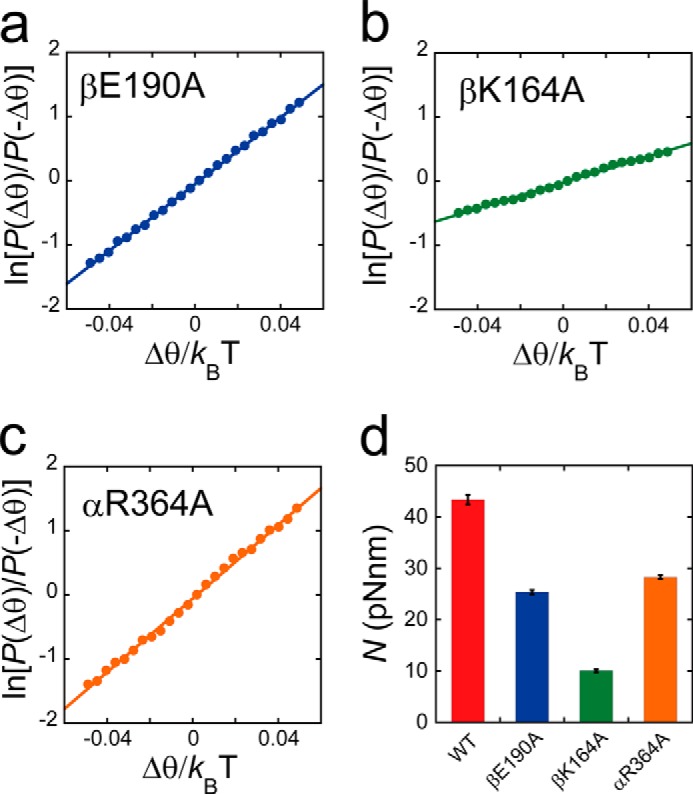
FIGURE 6.

Rotary torque. a–c, fluctuation theorem was employed for the torque measurement of F1(βE190A), F1(βK164A), and F1(αR364A). The ln(P(Δθ)/P(−Δθ)) is plotted against Δθ/kBT. The slope of this plot represents the rotary torque generated by F1. The average torque was determined from a linear approximation of all data points (solid line). d, torque (N) amplitudes generated by wild type F1, F1(βE190A), F1(βK164A), and F1(αR364A) are represented as red, blue, green and orange bars, respectively.
