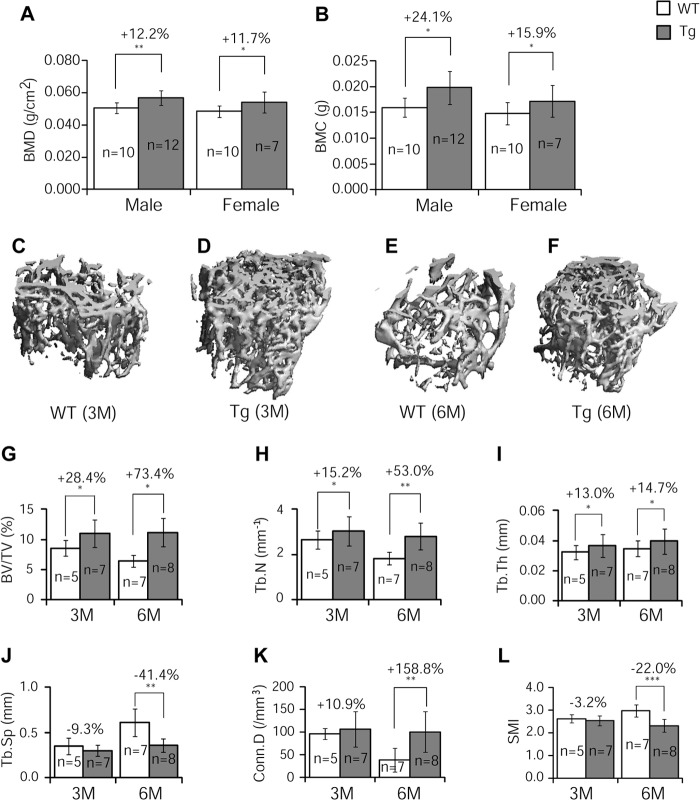
FIGURE 2.
DXA and μ-CT analyses. A and B, left femurs of 3-month-old GILZ Tg and WT littermate control mice were assessed by DXA scan for BMD (A) and BMC (B). C–F, representative three-dimensional reconstructed images of femoral samples from WT and GILZ Tg mice (males) at 3 months (C and D) and 6 months (E and F) of age. G–L, quantitative results showing BV/TV (G), Tb.N (H), Tb.Th (I), Tb.Sp (J), Conn. D (K), and structure model index (SMI, L) at 3 and 6 months of age. The data are shown as means ± S.D. n = 7–12 for DXA and n = 5–8 for μ-CT analysis, respectively. *, p < 0.05; **, p < 0.01; ***, p < 0.001. M, months.

