
FIGURE 1.
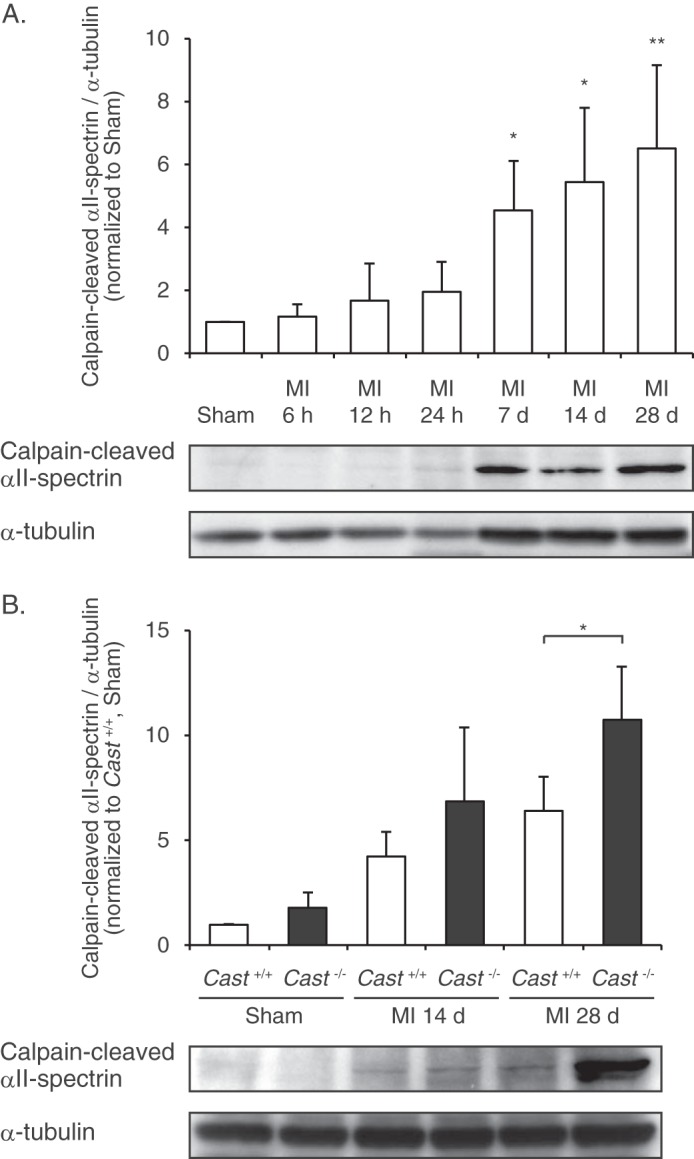
Calpain activity in MI hearts of Cast−/− and Cast+/+ mice. A, time course of calpain activation after MI, determined by immunoblot analysis of calpain-cleaved αII-spectrin in the hearts of wild-type mice (n = 5). α-Tubulin was used as an internal control for the amount of loaded protein. The calpain-cleaved αII-spectrin/α-tubulin ratios were quantified by densitometry and plotted (upper panel). Data are presented as the mean ± S.E. *, p < 0.05; **, p < 0.01 versus Sham. B, comparison of calpain activation after MI between Cast−/− and Cast+/+ mice (n = 3 ∼ 4). The calpain-cleaved αII-spectrin/α-tubulin ratios were quantified by densitometry and plotted (upper panel). Data are presented as the mean ± S.E. *, p < 0.05.