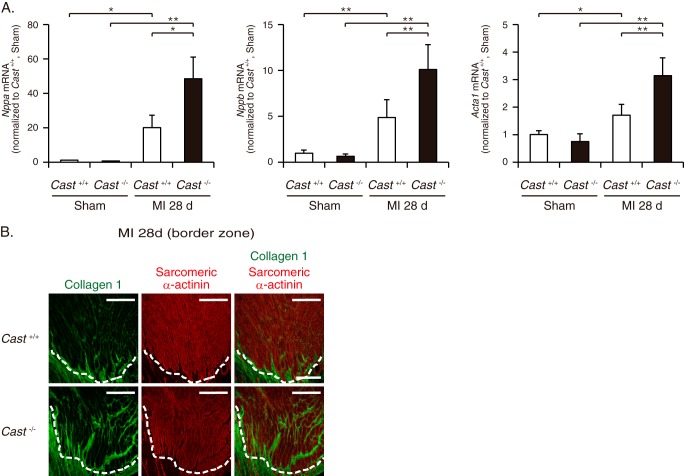
FIGURE 5.
Molecular and histological changes in the border zone of Cast−/− and Cast+/+ hearts after MI. A, the mRNA expressions of Nppa, Nppb, and Acta1 in the border zone of Cast−/− and Cast+/+ hearts at 28 days after MI and in sham-operated Cast−/− and Cast+/+ hearts (n = 3 ∼ 5, in each group). Values represent the mean ± S.E. *, p < 0.05; **, p < 0.01 versus sham-operated Cast+/+ mice. B, immunofluorescence of the border zone in Cast−/− and Cast+/+ hearts at 28 days after MI (n = 5, in each group). Collagen 1 and sarcomeric α-actinin are represented in green and red, respectively. Scale bars, 200 μm. The dotted lines indicate the boundary between the border zone where viable cardiomyocytes remain (above the dotted line) and the infarct zone (below the dotted line).

