FIGURE 1.
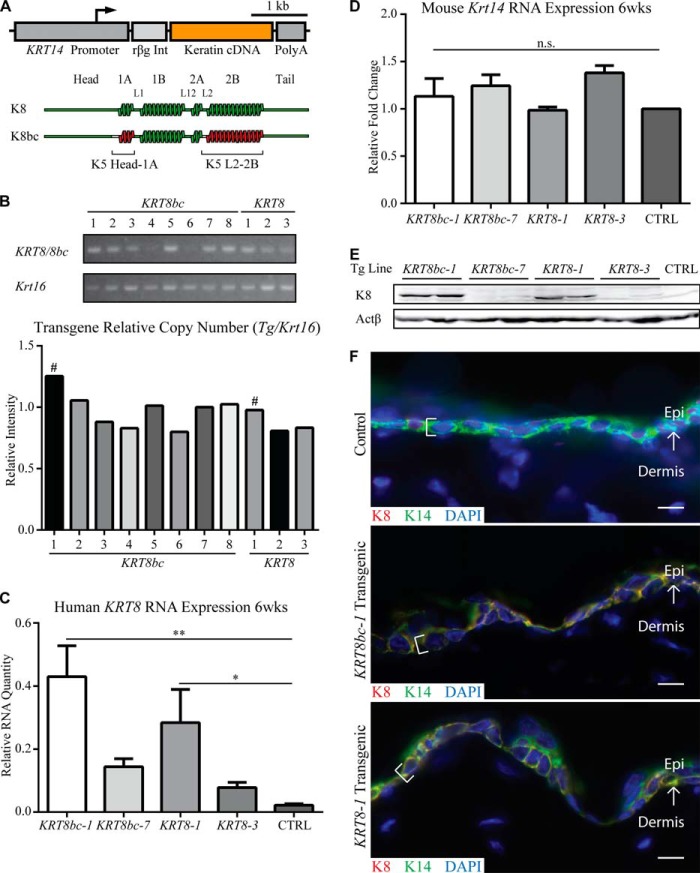
Generation and characterization of transgenes. A, schematic depiction of the transgenes used in this study. The human KRT14 gene promoter was used to drive the tissue-specific expression of keratin cDNAs (KRT8 and KRT8bc), and the rabbit β-globin intron (rβg Int) and human KRT14 3′-UTR sequence (Poly(A)) serve to stabilize the transgene mRNA in mouse cells. B, relative transgene copy number analysis was performed by conventional PCR of genomic DNA with transgene-specific primers. Krt16 was used as a single copy number reference gene. # indicates the highest relative copy number line for each transgene. C and D, quantitative RT-PCR analysis of transgenic human KRT8 mRNA (C) and endogenous mouse Krt14 mRNA (D) in back skin harvested from sex-matched 6-week-old animals. Relative RNA amount is normalized to both actin and Gapdh. CTRL indicates Krt5+/+ skin. Error bars represent S.E. A one-way analysis of variance (Dunnett's test) was used to test for significance, and the adjusted p values are reported. n.s., not significant; *, p < 0.04; **, p < 0.002. E, analysis of total skin protein extracts (10 μg/lane) by Western blotting in 6-week-old sex-matched adult animals. Two mice were analyzed for each of four transgenic lines; CTRL indicates Krt5+/+ skin. F, analysis of transgene expression in frozen skin sections of 6-week-old sex-matched adult animals. K8 epitopes are only present in basal layer keratinocytes (see brackets) of KRT8bc-1 and KRT8-1 transgenic epidermis and co-localizes with endogenous K14 in a normal keratin filament network. Control indicates Krt5+/+ skin. Arrows depict the interface between the epidermis (Epi) and dermis. Bars, 10 μm. wks, weeks.

