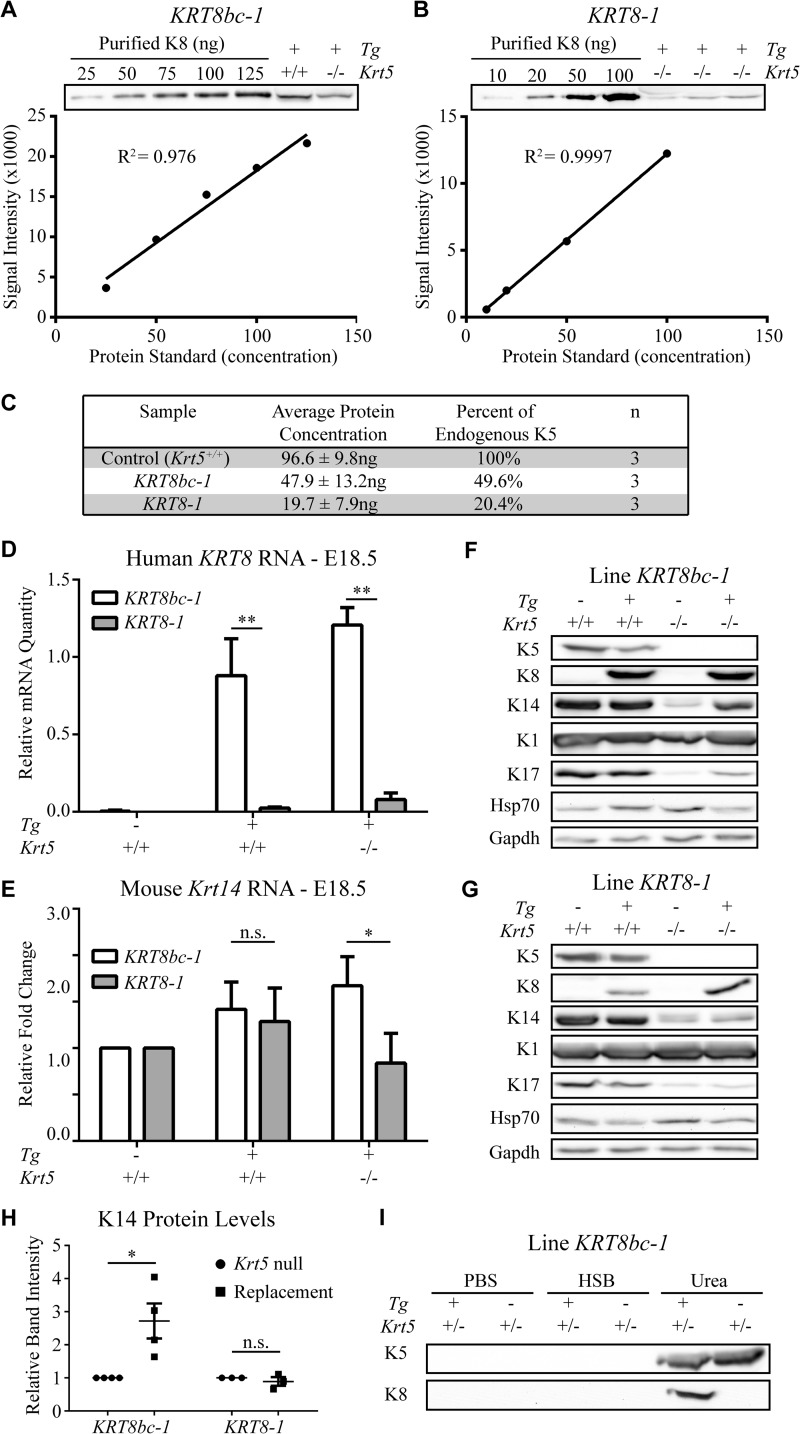
FIGURE 2.
Analysis of transgene expression in E18.5 mouse embryos. A and B, quantification of transgenic protein expressed in KRT8bc line 1 (KRT8bc-1; A) and KRT8 line 1 (KRT8-1; B) using standard curves of purified recombinant human K8. The line of best fit and R2 values were calculated using GraphPad Prism. C, summary of the transgenic protein quantification from multiple biological (n) and technical replicates. D, transgene RNA expression levels for lines KRT8bc-1 and KRT8-1 in E18.5 skin. E, endogenous Krt14 RNA expression levels for lines KRT8bc-1 and KRT8-1 in E18.5 skin. RNA levels are illustrated relative to actin and Gapdh. Error bars represent S.E. A two-way analysis of variance (Sidak's test) was used to test for significance, and the adjusted p values are reported. n.s., not significant; *, p < 0.005; **, p < 0.0001. F and G, expression of transgenic and endogenous proteins for lines KRT8bc-1 (F) and KRT8-1 (G) in E18.5 skin is shown by Western blot analysis. H, intensity of K14 protein signal relative to loading control signal was quantified, and the increase of K14 in the replacement mouse skin setting is illustrated. I, Western blot analysis of high salt extraction performed on KRT8bc-1 E18.5 skin. Even in the presence of endogenous K5 as a competitor, transgenic K8bc was still found in the insoluble pool. HSB, high salt buffer.

