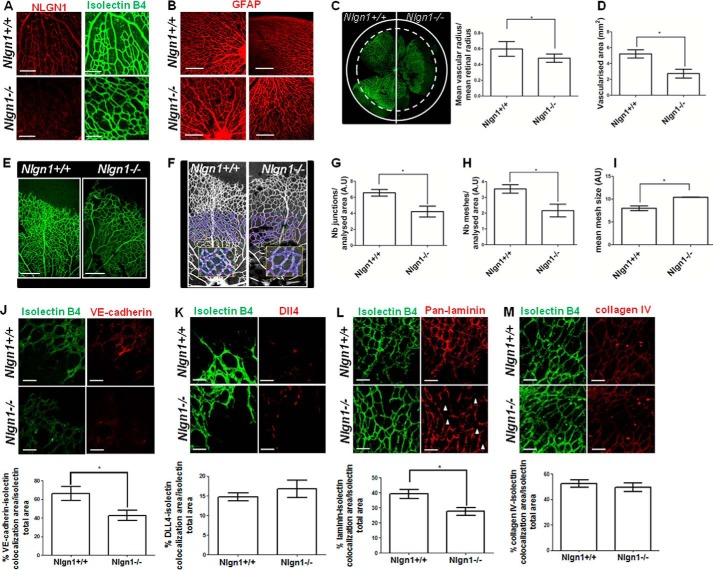
FIGURE 3.
NLGN1 null mice display an abnormal retinal angiogenesis. A, P5 mouse retina of WT (Nlgn1+/+) and NLGN1 null (Nlgn1−/−) mice were immunostained with isolectin B4 to visualize the retinal vascular vessels (green) and with the anti-NLGN1 antibody (clone H-45, red), which revealed no specific signal in NLGN1 null mice (bottom panel) compared with WT mice (top panel). Scale bar: 100 μm, n = 6 mice for each genotype. B, P5 retinas of both WT (Nlgn1+/+) and NLGN1 null (Nlgn1−/−) mice were immunostained with the anti-GFAP antibody to visualize the astrocytes. Images highlight the correct organization of astrocytes in NLGN1 null mice. n = 12 retinas for each genotype. Scale bar: 200 μm. C-I, evaluation of angiogenic parameters on P5 retinas of both WT and NLGN1 null mice (n = 15 retinas for each group) immunostained with the vascular marker isolectin B4. C, the confocal image highlights the differences in terms of vascular radius (C, left panel), quantified through the dashed circle tool of ImageJ 1.47, and the vascular area (D), evaluated through the Angiogenesis Analyzer plug-in for ImageJ. E and F, the images illustrate the altered vascular pattern of NLGN1 null mice (E) and the snapshot exhibiting the obtained model (F) used for the analysis of the number of junctions (G), the number of meshes (H), and the size of meshes (I). These parameters were calculated with the Angiogenesis Analyzer plug-in for ImageJ, in a circular area between 500 and 800 μm from the optic nerve (covered area of 1.22 mm2) representing a sample of a mature region of the network that excludes the growing front of the plexus. Values are expressed as mean ± S.E. (n = 3 independent experiments). Unpaired Student's t test, two-tailed resulted in: C, *, p = 0,033; D, *, p = 0.012; G, *, p = 0.026; H, *, p = 0.030; I, *, p = 0.011. Scale bars: E, 200 μm. J-M, confocal microscopy analysis of vascular markers on P5 retinas of both WT (Nlgn1+/+) and NLGN1 null mice (Nlgn1−/−) (n = 12 retinas for each group). Retinas were immunostained with isolectin B4 in combination with VE-cadherin (J), Dll4 (K), pan-laminin (L), or collagen IV (M). The percentage of colocalization was calculated with Image-Pro Plus 6.2 software as the surface area of each antibody staining, colocalizing with isolectin B4, normalized on the total surface vascular area. Values are expressed as mean ± S.E. (n = 3 independent experiments). Unpaired Student's t test, two-tailed results were: J, *, p = 0.047; K, p = 0.431; L, *, p = 0.020; M, *, p = 0.062. Scale bars for J–M, 50 μm.

