
FIGURE 7.
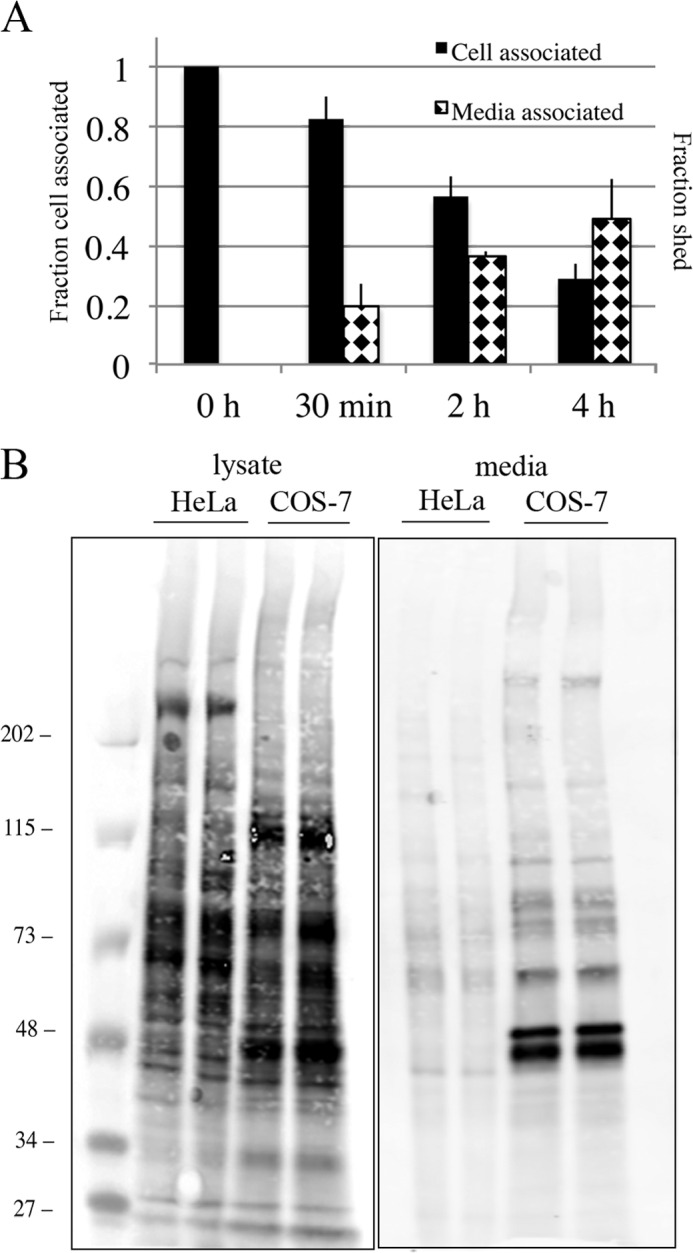
Elevated level of shedding of SNAP-Tac in COS cells. A, COS cells transfected with SNAP-Tac were labeled on ice with BG-800 for 30 min. At the indicated time points after shift to 37 °C, lysates and media were collected and processed as described under “Experimental Procedures.” The black bars indicate the fraction of cell-associated SNAP-Tac remaining after each time point (left axis), and the diamond-hatched bars indicate the fraction shed into the medium (right axis). Shedding of SNAP-Tac in COS cells is significantly enhanced when compared with HeLa cells (see Fig. 5, E and F). The bar graph represents normalized data averaged from three independent experiments ±S.D. (error bars). B, COS or HeLa cells were plated in 10-cm dishes, surface-labeled with NHS-PEG4-biotin for 30 min at room temperature, and then chased for 5 h in serum-free medium. After collecting media and lysing cells, samples were run on an SDS-polyacrylamide gel, then transferred onto nitrocellulose, and incubated with DyLight 800-conjugated NeutrAvidin to detect biotinylated proteins. Equivalent protein levels and media volumes were loaded for each cell type. The scanned sensitivity of the lysate samples was reduced 6-fold to visualize individual protein bands. The migration of prestained molecular mass markers (in kDa) is shown.