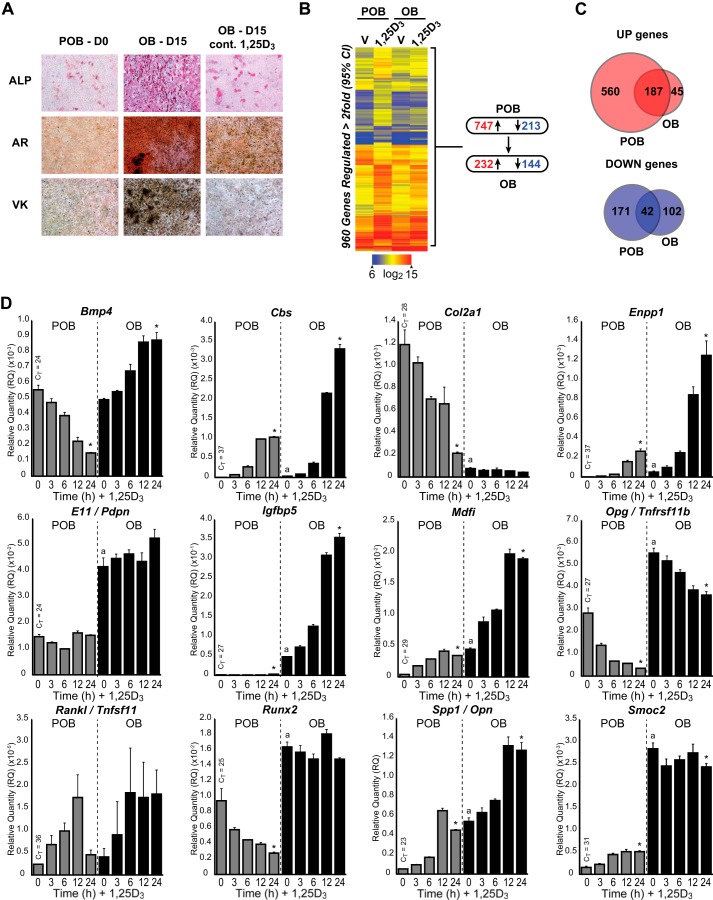
FIGURE 1.
Effects of 1,25(OH)2D3 on gene expression during MC3T3-E1 osteoblast differentiation. A, POB cells differentiated for 15 days to OB cells were treated with 10−7 m 1,25(OH)2D3 (1,25D3) or vehicle every 3 days during culture. Plates were stained with alkaline phosphatase (ALP), von Kossa (VK), and Alizarin Red (AR). B, gene expression heatmap of vehicle (V) or 1,25(OH)2D3 (1,25D3)-treated POB and OB cells. Blue, low expression; red, high expression. Genes shown in each row refer to POB differentially regulated genes. Summary of gene changes is shown to the right, with down-regulated <2-fold shown in blue and up-regulated >2-fold shown in red. C, Venn diagram representation of up-regulated (top, red) and down-regulated (bottom, blue) genes that overlap in POB and OB cells. D, gene expression time course (0, 3, 6, 12, and 24 h) of 10−7 m 1,25(OH)2D3 treatment in POB and OB cells by TaqMan RT-qPCR. Data are displayed as relative quantitation (RQ) compared with β-actin ± S.E. *, p < 0.05, 24 h versus 0 h within cell type by one-way analysis of variance. a, p < 0.05, POB 0 h versus OB 0 h by two-way analysis of variance with Dunnett's post test.

