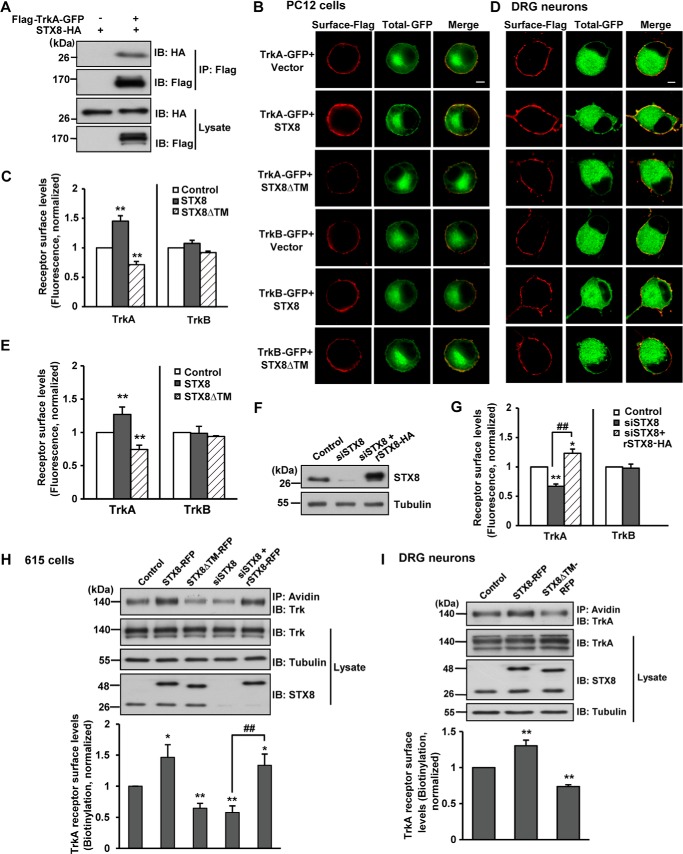
FIGURE 2.
STX8 regulates cell surface levels of TrkA but not TrkB receptors in PC12 cells. A, co-immunoprecipitation of FLAG-TrkA-GFP and STX8-HA in HEK293 cells. Lysates were immunoprecipitated with anti-FLAG antibody followed by immunoblotting (IB) with anti-FLAG or anti-HA antibodies. B, ratiometric fluorescence assay to quantify Trk receptors cell surface levels. PC12 cells transfected with FLAG-Trk-GFP, STX8-HA, STX8ΔTM, or control vector construct were stained with an anti-FLAG antibody under a nonpermeabilization condition to label surface Trk receptors; the GFP fluorescence represented total receptor levels. Scale bar, 5 μm. C, quantification of Trk surface levels by the ratio of red to green fluorescence intensity in B (**, p < 0.01, versus the respective controls; one-way ANOVA). D, ratiometric fluorescence assay to quantify Trk receptors cell surface levels in cultured DRG neurons. The neurons transfected by electroporation with indicated constructs were stained with an anti-FLAG antibody under a nonpermeabilization condition to label surface Trk receptors; the GFP fluorescence represented total receptor levels. The neurons were visualized by confocal microscopy. Scale bar, 5 μm. E, quantification of Trk cell surface levels by the ratio of red to green fluorescence intensity in C. The data were normalized to their respective controls (**, p < 0.01, one-way ANOVA). F, PC12 cells transfected with siSTX8 or siSTX8 with the siRNA-resistant rSTX8-HA were lysed and immunoblotted with STX8 antibody to detect the STX8-knockdown efficiency by siSTX8. G, quantification of surface Trk levels in PC12 cells by the ratiometric fluorescence assay as performed in B (*, p < 0.05; **, p < 0.01, versus the control group; ##, p < 0.01, versus the STX8 knockdown group, one-way ANOVA for TrkA, Student's t test for TrkB). H, cell surface levels of TrkA receptors were evaluated by surface biotinylation assay in 615 cells (PC12 cells stably expressing TrkA) transfected by electroporation. Lower panel, quantification of the surface levels of TrkA receptors by the ratio of surface to total TrkA intensity normalized to the control group. All of the data are shown as means ± S.E. from at least three independent experiments (*, p < 0.05; **, p < 0.01, versus the control group; ##, p < 0.01, versus the STX8 knockdown group, one-way ANOVA). I, TrkA cell surface levels were measured by surface biotinylation assay in cultured DRG neurons infected with lentiviruses harboring STX8-RFP, STX8ΔTM-RFP, or control RFP. Lower panel, quantification of TrkA cell surface levels. All of the data are shown as means ± S.E. from at least three independent experiments (**, p < 0.01, one-way ANOVA).

