FIGURE 5.
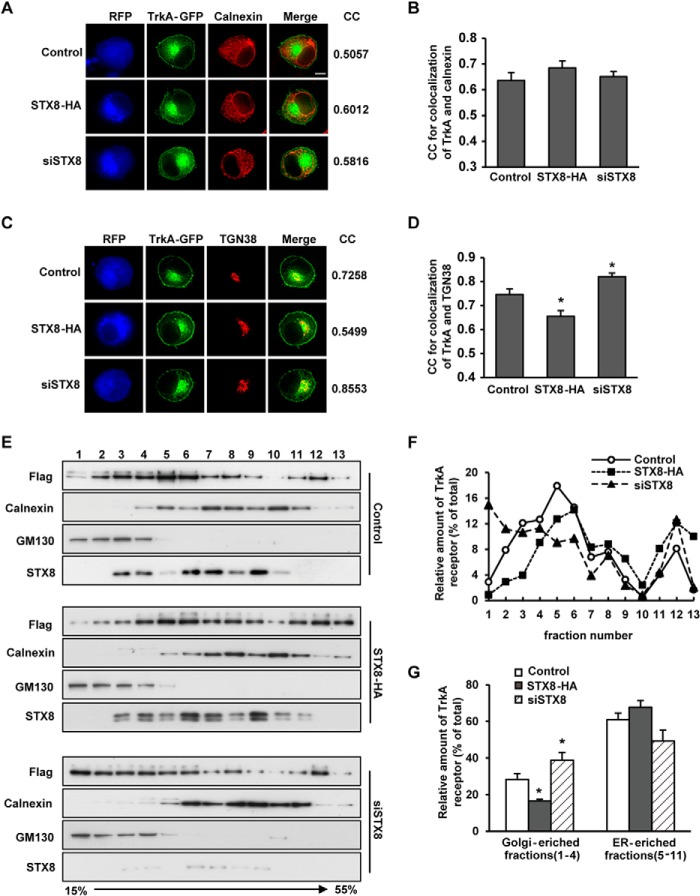
STX8 promotes TrkA trafficking from the Golgi to the plasma membrane. A, correlation analysis of the co-localization of TrkA-GFP and the ER marker calnexin in PC12 cells. PC12 cells transfected with FLAG-TrkA-GFP and STX8-RFP, pSuper-siSTX8-RFP, or the control construct pmRFP-N1 were stained with anti-calnexin antibody and Cy5-conjugated secondary antibody after permeabilization. The blue and red pseudo-colors represent RFP and calnexin, respectively. The correlation coefficients (CC) between TrkA and calnexin were measured using the MetaMorph correlation plot module. Scale bar, 5 μm. B, quantification of the CC in A. C, correlation analysis of the co-localization of TrkA-GFP and the trans-Golgi network marker TGN38 as described in A. D, quantification of the CC in C. The results are presented as the mean ± S.E. from three independent experiments. E, post-nuclear supernatants of PC12 cells transfected with FLAG-TrkA and STX8-HA, siSTX8, or control vector construct were fractioned on an isopycnic 15–55% (w/w) linear sucrose gradient, and equal aliquots of the final equilibrium gradient fractions (top, fraction 1) were immunoblotted using antibodies against GM130, calnexin and FLAG (for detecting FLAG-TrkA). F, quantification of TrkA immunoreactivity in the gradient fractions presented as a percentage of the total (the sum of the gradient fractions) among the three groups. G, quantification of the TrkA relative intensity in the Golgi- or ER-enriched fractions, presented as a percentage of the total. The data show the means of three independent experiments (*, p < 0.05, versus their corresponding controls, one-way ANOVA).

