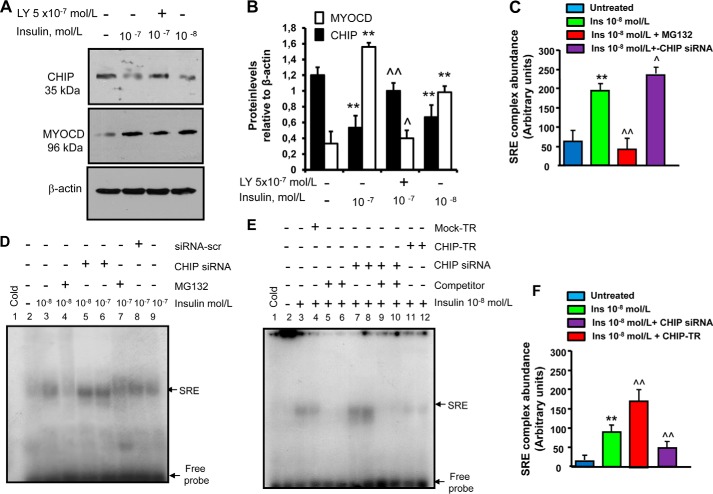
FIGURE 3.
CHIP-dependent insulin induction of myocardin levels and of SRF-SRE binding activity. A, insulin-mediated reduction of chaperone-associated ubiquitin (Ub) E3 ligase CHIP. Canine cardiac myoblasts were starved by growth factor withdrawal and serum reduction (decreased to 2%) for 12 h followed by stimulation with pathophysiologically relevant concentrations of insulin (10−8–10−7 mol/liter) for 24 h with or without the Akt inhibitor LY294002 (5 × 10⁻⁷ mol/liter), which was added to the medium 30 min prior to insulin. Following treatments, CHIP and MYOCD expressions were detected by immunoblotting. Here shown is a blot representative of three independent experiments. B, results of scanning densitometry (n = 3 independent experiments) expressed as arbitrary optical density units. Columns and bars represent the mean ± S.D. (**, p < 0.01 versus untreated cells; ^^, p < 0.01 versus insulin-treated cells; ^, p < 0.05 versus insulin-treated cells). C, densitometry of protein-DNA complexes in three different EMSA experiments represented in panel D. **, p < 0.01 versus untreated cells; ^^, p < 0.01 versus insulin-treated cells; ^, p < 0.05 versus insulin treated cells. D–F, CHIP-dependent, insulin-mediated increase of SRF-SRE binding activity. D, canine cardiac myoblasts were transfected with a pool of three different CHIP siRNA oligonucleotides or a scrambled (scr) siRNA (negative control), and treated with insulin (10−8–10−7 mol/liter) for 2 h. A parallel set of cardiac myoblasts was pre-treated with the proteasome inhibitor MG132 (10 μmol/liter) for 6 h prior to the addition of insulin. E, canine cardiac myoblasts were mock-transfected (mock-TR, negative control) or transfected with CHIP (CHIP-TR), or transfected with a pool of three different CHIP siRNA oligonucleotides, then treated with 10−8 mol/liter insulin for 2 h. After treatments, nuclear extracts (10 μg) were incubated with or without 32P-end-labeled SRE oligonucleotides. Specificity of the SRF-SRE complex formation was determined by showing competition with an unlabeled oligonucleotide. EMSA representatives of three independent experiments are shown. F, densitometry of protein-DNA complexes in three different EMSA experiments represented in panel E. **, p < 0.01 versus untreated cells; ^^, p < 0.01 versus insulin-treated cells.

