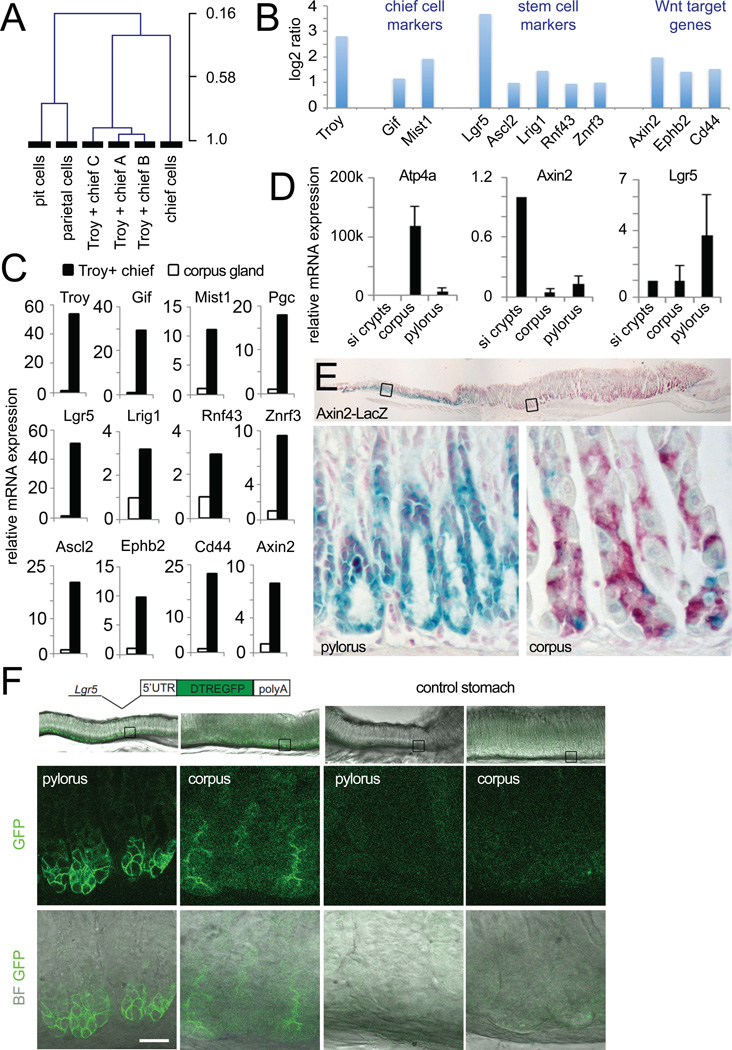
Fig. 4. Transcriptional profile of Troy+ chief cells.
(A) Unsupervised hierarchical clustering joins the Troy+ chief cell arrays with a chief cell array prepared from laser-captured chief cells, while pit and parietal cell arrays cluster in a separate tree (data taken from Gene Expression Omnibus dataset GSE5018 (Ramsey et al., 2007). (B) Log2 ratio of selected genes comparing the Troy+ chief cell arrays to arrays from whole corpus glands. Troy+ chief cells show enrichment of marker genes for chief, digestive tract stem cells and Wnt target genes. (C) qPCRs performed on a separately sorted set of Troy+ chief cells and compared to corpus glands (set to 1) confirms enrichment of all marker genes depicted in B in Troy+ chief cells. Data are represented as mean +/− SEM of 3 qPCRs. (D) Comparison of the expression level of the Wnt target gene Axin2 and the stem cell marker Lgr5 between small intestine, gastric corpus and pylorus. Data are represented as mean +/− SEM of 3 qPCRs. (E) LacZ staining of the Axin2-LacZ reporter mouse documents expression of Axin2 in a few gland bottom cells in the gastric corpus (nuclear red counter stain). (F) Endogenous eGFP expression in the Lgr5-DTR:eGFP reporter mouse visualizes Lgr5 expression at the bottom of gastric corpus glands. See also Fig. S4 and Table S1.

