
Figure 2. Disease-related defects associated with presence of extra cilia.
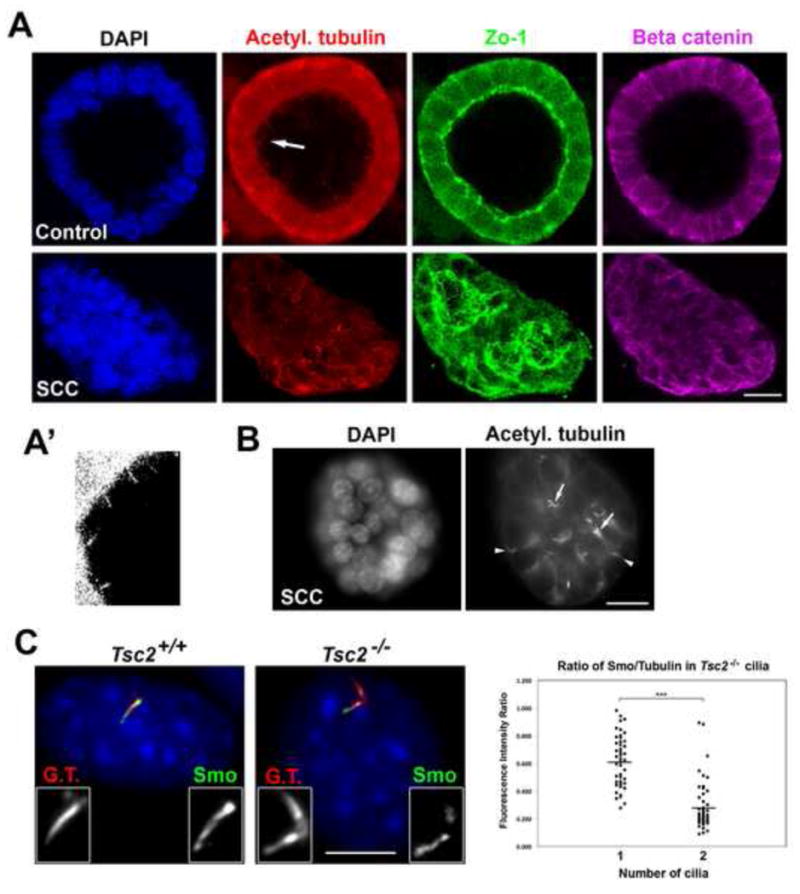
(A–B) Immunofluorescence images of mono-ciliated (Control) and super-ciliated (SCC) IMCD-3 cells grown in 3D culture. Most mono-ciliated cells formed spheroids with a prominent lumen (93%, N = 400), whereas most super-ciliated cells failed to develop spheroids (84%, N = 400); P < 0.0001. Arrow in (A) denotes the region that is magnified 3-fold and displayed in (A′). Arrows in (B) mark cells in an SCC cluster with multiple cilia; arrowheads mark mis-oriented cilia. Scale bars, 10 μm. (C) Immunofluorescence images of endogenous Smo (green) in mono-ciliated Tsc2+/+ and bi-ciliated Tsc2−/− MEFs, co-stained with glutamylated tubulin (G.T., red) and DNA (blue). Scale bar, 10 μm. Graph (right panel) shows ratio of Smo/glutamylated tubulin levels. N = 50 for each sample (from 2 independent experiments; P < 0.0001).