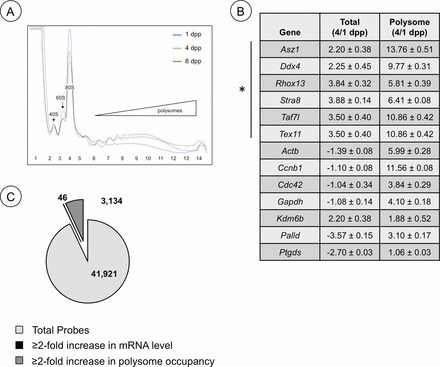
FIG. 5.

Changes in mRNA and ribosome utilization during neonatal testis development. A) Overlay of polysome gradient profiles from 1, 4, and 8 dpp testis lysates. Blue line, 1 dpp; red line, 4 dpp; green line, 8 dpp polysome profile. B) Quantitative RT-PCR was used to assess mRNA levels for the genes indicated. The data is represented as a ratio of message abundance from total RNA (Total) or RNA isolated from heavy polysome fractions (Polysome) from testes of 4 dpp/1 dpp mice and from RA/dimethyl sulfoxide-injected mice. C) A representation of the results from TSAA and previous microarray results [5] depicting relative numbers of testicular mRNAs that increased ≥2-fold in abundance, became enriched ≥2-fold in heavy polysomes, or were unchanged from 1 to 4 dpp.
