
FIG. 1.
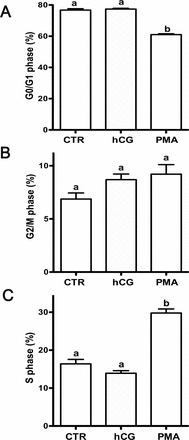
Ovcar3 cell cycle kinetics after hCG or PMA treatment. Ovcar3 cells were serum starved for 24 h and treated with 1 IU hCG or 20 nM PMA for an additional 24 h. Percentage of the cells in (A) the G0/G1stage of the cell cycle, (B) the G2/M stage of the cell cycle, or (C) the S phase of the cell cycle. Results are the means ± SEM for at least three separate measurements from three individual experiments. Bars that do not share a letter designation are significantly different (P < 0.05).