
FIG. 2.
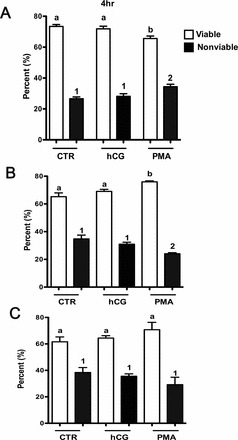
Apoptosis of Ovcar3 cells after hCG or PMA treatment. Ovcar3 cells were serum starved for 24 h and treated with vehicle control (DMSO), 20 nM PMA, or 1 IU hCG for (A) 4 h, (B) 8 h, or (C) 12 h. Results are the means ± SEM of at least three separate measurements from three individual experiments. White bars represent viable cells; black bars represent cells undergoing early and late apoptosis as well as those that are dead. Bars that do not share a letter or number designation are significantly different (P < 0.05).