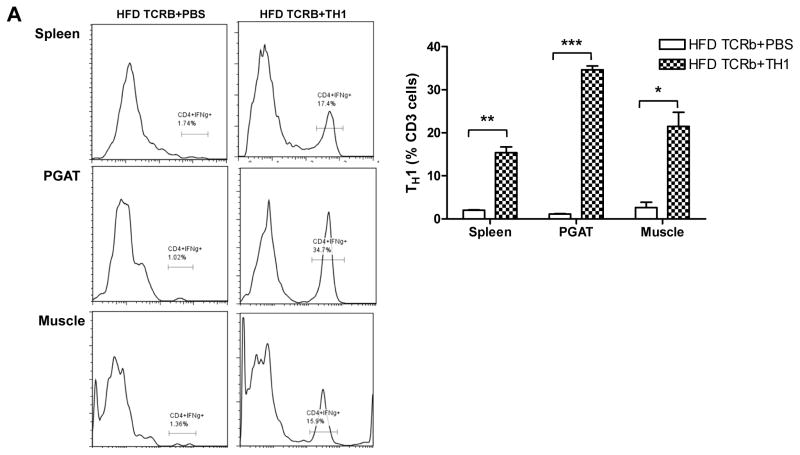
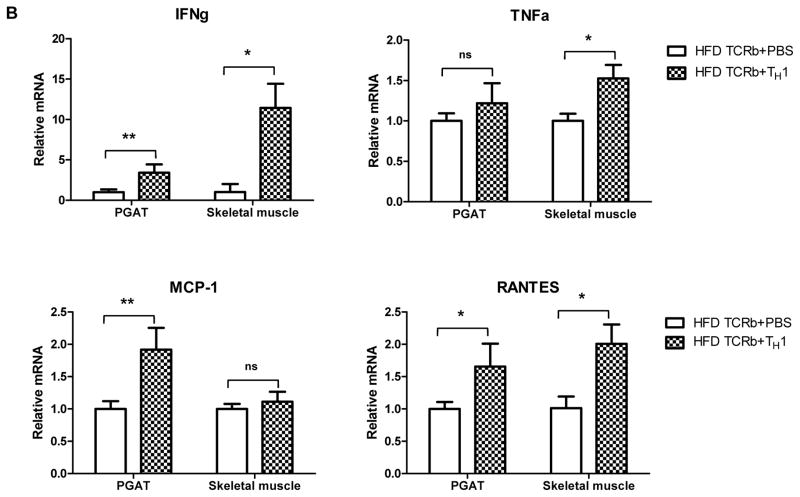
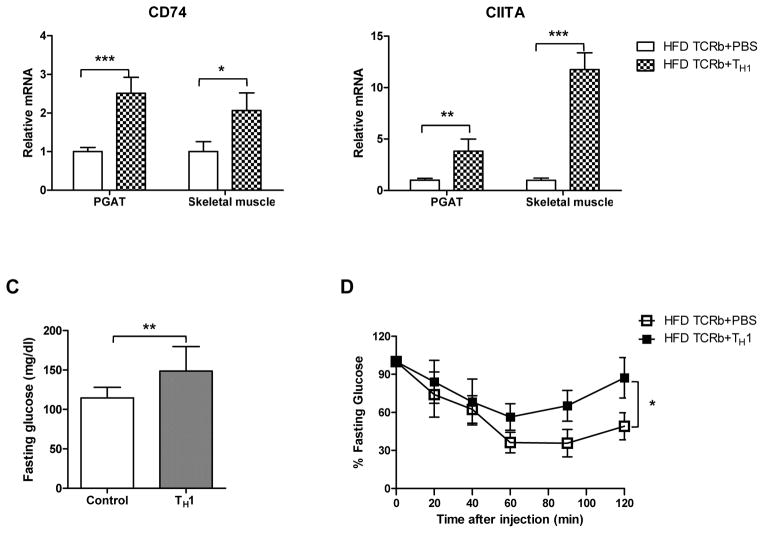
Figure 5. TH1 adoptive cell transfer reverses metabolic characteristics of HFD-fed TCRb−/− mice.
(A) Representative histograms and flow cytometry result summary showing the homing of TH1 cells into spleen, PGAT, and skeletal muscle of HFD-fed TCRb−/− mice after adoptive transfer (n=3–4 mice/group). (B) Inflammatory gene expression in PGAT and skeletal muscle of HFD-fed TCRb−/− mice injected with PBS or TH1 cells (n=5 mice/group). (C) Fasting glucose and (D) insulin tolerance test in HFD-fed TCRb−/− mice after 12 weeks of adoptive TH1 cell transfer (n=8 mice/group). Panels A and B are shown as mean±SEM; panels C and D are shown as mean±SD of 2 separate experiments. *P<0.05, **P<0.01, ***P<0.001.


