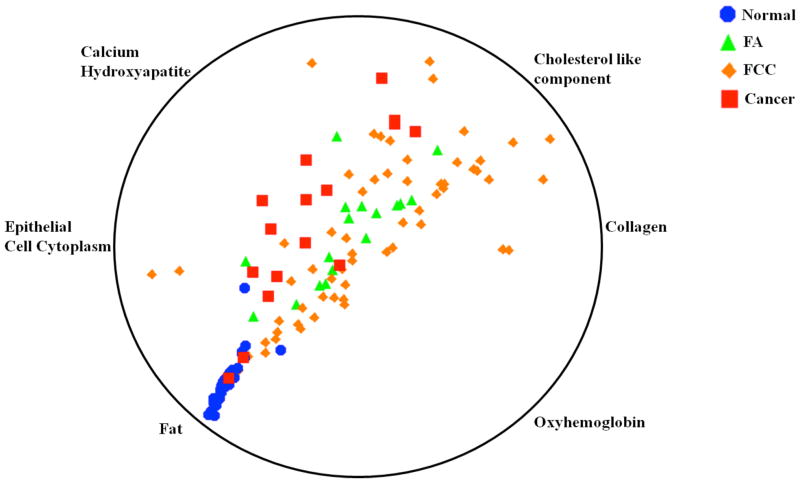
Figure 1.
Multi-dimensional radial visualization plot of selected breast model fit coefficients obtained from the tissue Raman spectra. The plot illustrates the clustering behavior of the specimens belonging to each tissue histopathology class. Further details of the plot and selection of the fit coefficients are provided in the text.

