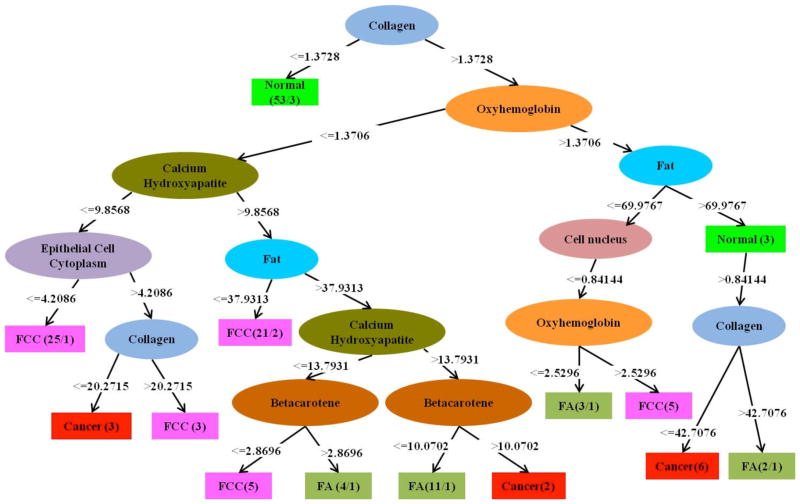
Figure 2.
Decision tree generated using the C4.5 algorithm on the fit coefficients obtained from the tissue Raman spectra. Here, ellipses indicate intermediate nodes and rectangles represent the final nodes. The binary discrimination rules are represented in the branches following the nodes and the number of specimens distinguished as a specific class is given in the rectangle.

