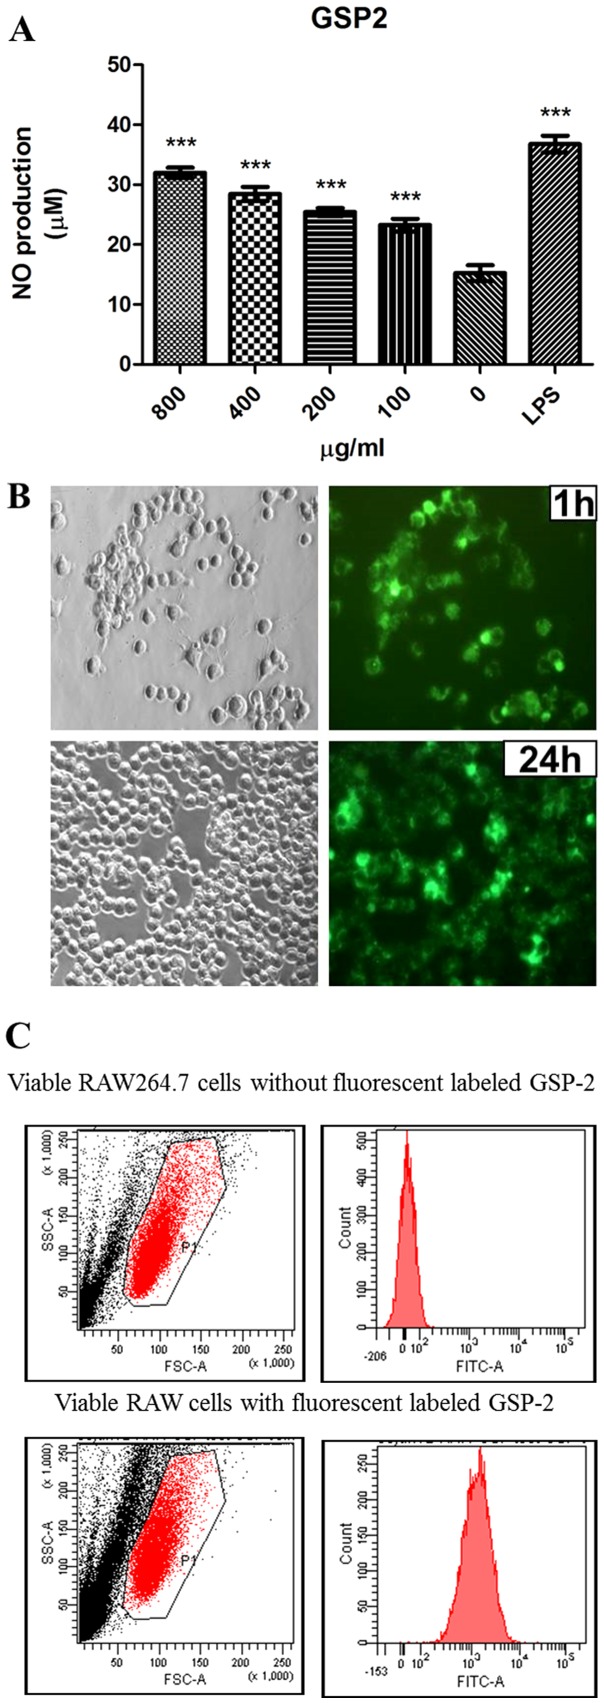
Figure 4. Nitric oxide production and phagocytosis of GSP-2-treated RAW 264.7 cells.
A: The levels of NO production of RAW264.7 cells were assessed after incubation with GSP-2 or LPS for 24 h using Griess assay. All data are expressed as mean ± SEM of three individual experiments (n = 12). Significant difference: *, P<0.05; **, P<0.01; ***, P<0.001 for difference from culture without treatment. B: The viable RAW 264.7 cell populations were gated (left) and the FITC-positive population was shown in fluorescent-GSP-2-labeled cells (lower right histogram). C: RAW 264.7 cells were incubated with 10 µg GSP-2 (fluro-labeled) for 24 h. The cells were imaged at the 1st and 24th hour (lower histograms). After 24 h incubation, the cells were collected, washed and resuspended in PBS and the fluorescence of the samples was detected by flow cytometry. (Upper histograms: viable RAW 264.7 cells without fluorescent labeled GSP-2, lower histograms, 1st hour: viable RAW 264.7 cells with fluorescent labeled GSP-2, 24th hour).

