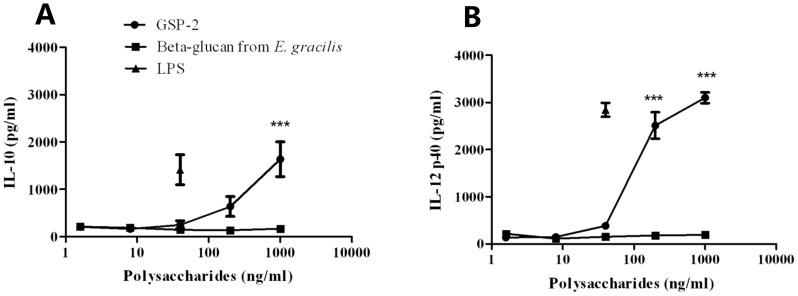
Figure 6. Cytokine productions of GSP-2-treated moDC.
Culture supernatants were collected 48-2 and the cytokines concentrations were specifically determined by ELISA. Lines represented mean percentage ± S.E.M. of duplicates (n = 8). LPS and Beta-glucan from E. gracilis were used as positive control. Significant difference: *, P<0.05; **, P<0.01; ***, P<0.001 for difference from culture without treatment.

