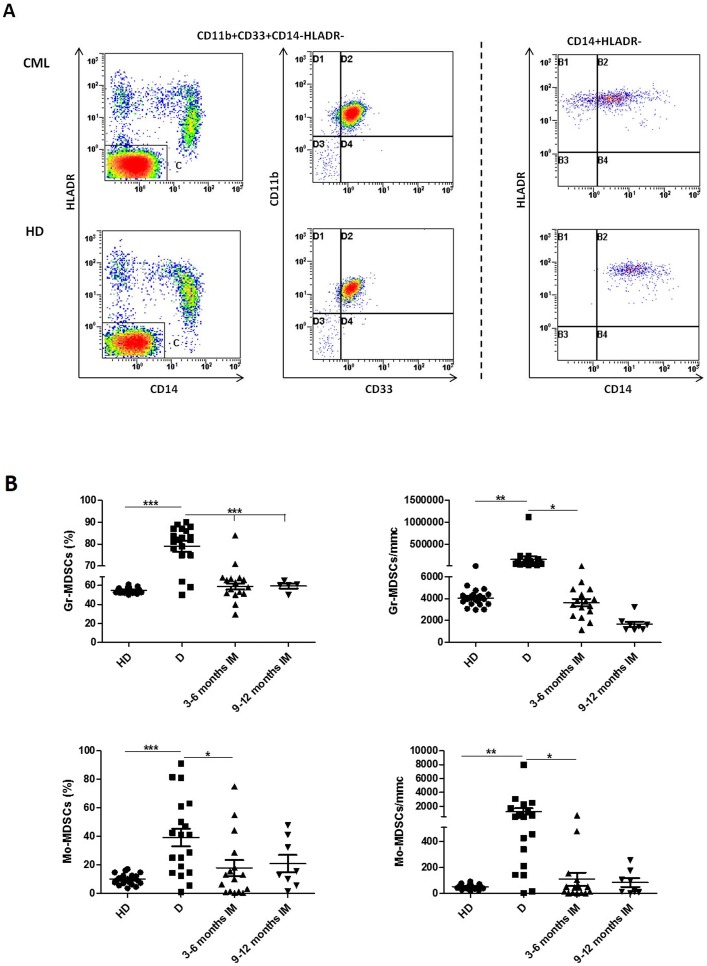
Figure 1. Flow cytometry analysis of circulating Gr-MDSCs and Mo-MDSCs cells in PB from HD and CML patients at diagnosis (D) and during IM therapy.
A: Representative data from one HD and one CML at diagnosis. Flow cytometry analysis was performed with gates set on either CD11b+CD33+CD14-HLADR- or CD14+HLADR-cells populations. B: Figures show the quantitative data for Gr-MDSCs and Mo-MDSCs. Results are expressed either as percentage or absolute number. Statistically significant differences between groups are indicated by P-value in the figures.

