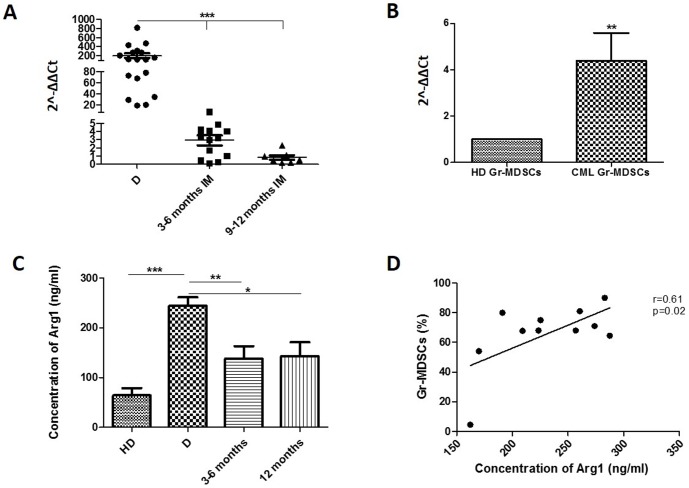
Figure 3. Increased Arg1 expression in CML patients at diagnosis.
A: Arg1 mRNA expression in HD and CML patients at diagnosis (D) and during IM therapy assessed by real time PCR. Healthy donors (HD) vs D and D vs therapy: p<0.0001. B: Levels of Arg1 mRNA in Gr-MDSCs from HD and CML patients at diagnosis. The expression resulted higher in CML Gr-MDSCs in respect to HD (calculated value of 2∧-ΔΔCt in HD was 1; p<0.001). C: Arg1 concentration measured by ELISA. Circulating protein was increased in CML patients at diagnosis compared to HD (p<0.0001) and decreased during IM therapy (D vs 3–6 and 12 months: p<0.001 and p<0.05 respectively). D: Correlation of the percentage of Gr-MDSCs cells in PB and Arg1 levels in serum of CML patients at diagnosis.

