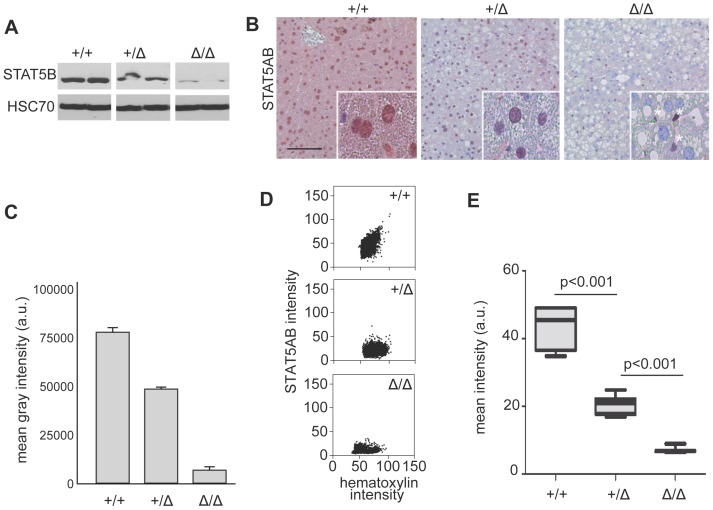
Figure 1. STAT5AB protein expression in mouse Stat5ab+/+, Stat5ab+/Δ and Stat5abΔ/Δ livers.
A STAT5AB protein expression in Stat5ab+/+ (n = 2), Stat5ab+/Δ (n = 2) and Stat5abΔ/Δ (n = 2) livers determined by Western blot (see Figure S1 in File S1 for non-cropped Western blot) and HSC70 as loading control. B IHC staining of STAT5AB in histological sections of the livers (n = 3) used in A. Red, AEC; blue, hematoxylin. Insets are higher magnifications. White stars indicate STAT5AB expression in Kupffer cells and endothelial cells, whereas the hepatocytes are negative for STAT5AB expression. Size bar: 100 µm. C Densitometric scanning of the Western blot and quantification of STAT5AB levels (n = 2). Error bars indicate the data range. D Dot-blot of STAT5AB IHC quantification from Stat5ab+/+, Stat5ab+/Δ and Stat5abΔ/Δ livers. E Whisker-box blots depicting the quantification of STAT5AB protein levels from D using the HistoQuest software. The box indicates the interquartile range; the horizontal line in the box depicts the median; whiskers indicate the data range. 3788 Stat5ab+/+, 3041 Stat5abΔ/+ and 753 Stat5abΔ/ Δ cells (hepatocytes) were analyzed in total. One-way ANOVA testing proved that the measured differences were of significance (p<0.001).

