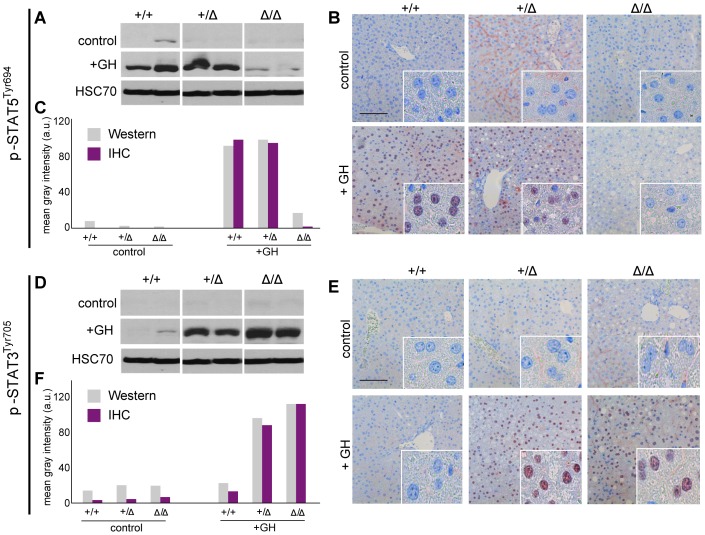
Figure 2. p-STAT5Tyr694 and p-STAT3Tyr705 expression upon GH treatment compared to control mice.
A Western Blot of p-STAT5Tyr694 expression in Stat5ab+/+ (n = 2), Stat5ab+/Δ (n = 2) and Stat5abΔ/Δ (n = 2) livers of GH treated and control mice. HSC70 is shown as loading control. B IHC of p-STAT5Tyr694 in sections of the livers (n = 3) used in A. Red, AEC; blue, hematoxylin. Size bar: 100 µm. High magnifications (60x) are shown in insets. C Quantification of p-STAT5Tyr694 levels from Western blots (grey) by densitometric scanning and IHC (magenta) using the HistoQuest software (Stat5ab+/+, control; number of cells n = 3276, GH; number of cells n = 2286; Stat5ab+/Δ control; number of cells n = 2577, GH; number of cells n = 3549; Stat5abΔ/Δ control; number of cells n = 3299, GH; number of cells n = 2200). The highest arbitrary expression values from A and B were set to 100 for direct comparison. D Western blot of p-STAT3Tyr705 expression in Stat5ab+/+ (n = 2), Stat5ab+/Δ (n = 2) and Stat5abΔ/Δ (n = 2) livers of GH treated and control mice. HSC70 is shown as loading control. E IHC of p-STAT3 Tyr705 in sections of the livers (n = 3) used in D. Red, AEC; blue, hematoxylin. Size bar: 100 µm. High magnifications are shown in insets (60x). F Quantification of p-STAT3Tyr705 levels from Western blots (grey) by densitometric scanning and IHC (magenta) using the HistoQuest software (Stat5ab+/+, control; number of cells n = 2634, GH; number of cells n = 2286; Stat5ab+/Δ control; number of cells n = 22230, GH n = 2562; Stat5abΔ/Δ control; number of cells n = 2414, GH n = 2716). The highest arbitrary expression values from A and B were set to 100 for direct comparison.

