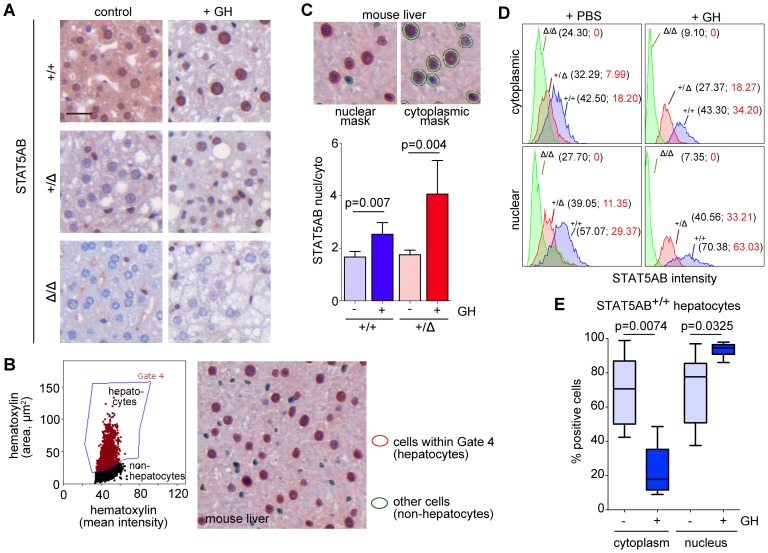
Figure 3. Detection and quantification of transcription factor translocation into the nucleus in mouse livers.
A IHC of STAT5AB expression in Stat5ab+/+ (n = 3), Stat5ab+/Δ (n = 3) and Stat5abΔ/Δ (n = 3) livers of GH treated and control mice. Size bar: 50 µm. B Scattergram of the analyzed IHC samples used in A. Discrimination of hepatocytes due to their hematoxylin area and mean intensity depicted in gate 4. Image of gated (hepatocytes, red circled) and of non-hepatocytic cells, mainly Kupffer cells (green circled) in an IHC stained liver sample. C Nuclear and cytoplasmic mask of cells as they are recognized by HistoQuest. The bar graph shows the ratios of nuclear versus cytoplasmic STAT5AB expression levels. Error bars are S.D. Student's t-test was performed to demonstrate statistical significance. D Histograms of nuclear/cytoplasmic STAT5AB intensities are shown; Stat5ab+/+ (blue), Stat5ab+/Δ (red) and Stat5abΔ/Δ (green). The corresponding values in the histograms (black values) showed the gradual decrease of the mean intensities. Based on the fact that Stat5abΔ/Δ mice have no hepatic STAT5AB their values in the histograms can be set as background intensity. After background subtraction the numbers displayed the expected 2∶1∶0 ratios (red values). E Whiskers-box plots depicting the quantification of STAT5AB positive hepatocytes (cytoplasmic C; nuclear N) from Stat5ab+/+ with and without GH stimulation using the HistoQuest software. The box indicates the interquartile range; the horizontal line in the box depicts the median. Whiskers indicate the data range. Student's t-test was used to demonstrate statistical significance.

