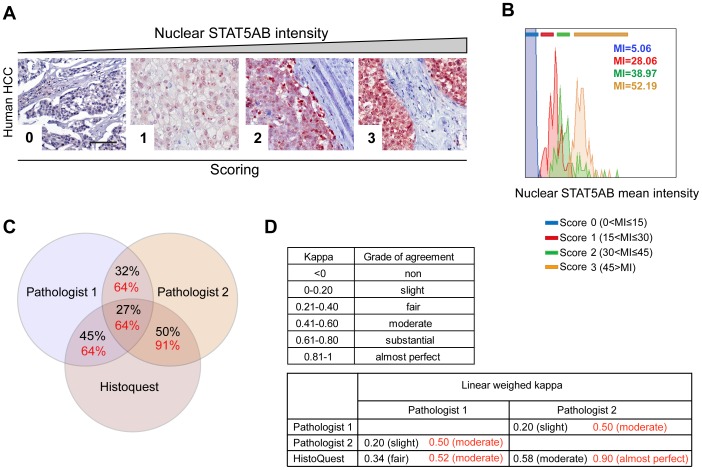
Figure 4. Analysis and evaluation of STAT5AB in human HCC samples and the detection of interobserver variabilties.
A Representative images of human HCC with different nuclear STAT5AB expression levels (0, 1, 2, 3) which were scored corresponding to pathological evaluation. Size bar: 100 µm. B Histograms from image analysis based quantification of nuclear STAT5AB in the representative images from A. Mean intensity (MI) values and scoring zones are depicted. C Venn diagram depicting the percent overlaps from two pathologists and image analysis on the assessment of nuclear STAT5AB. D Linear weighed kappa analysis depicting the grade of agreement between the evaluating pathologists and the HistoQuest software before (black values) and after software-assisted re-evaluation (red values).

