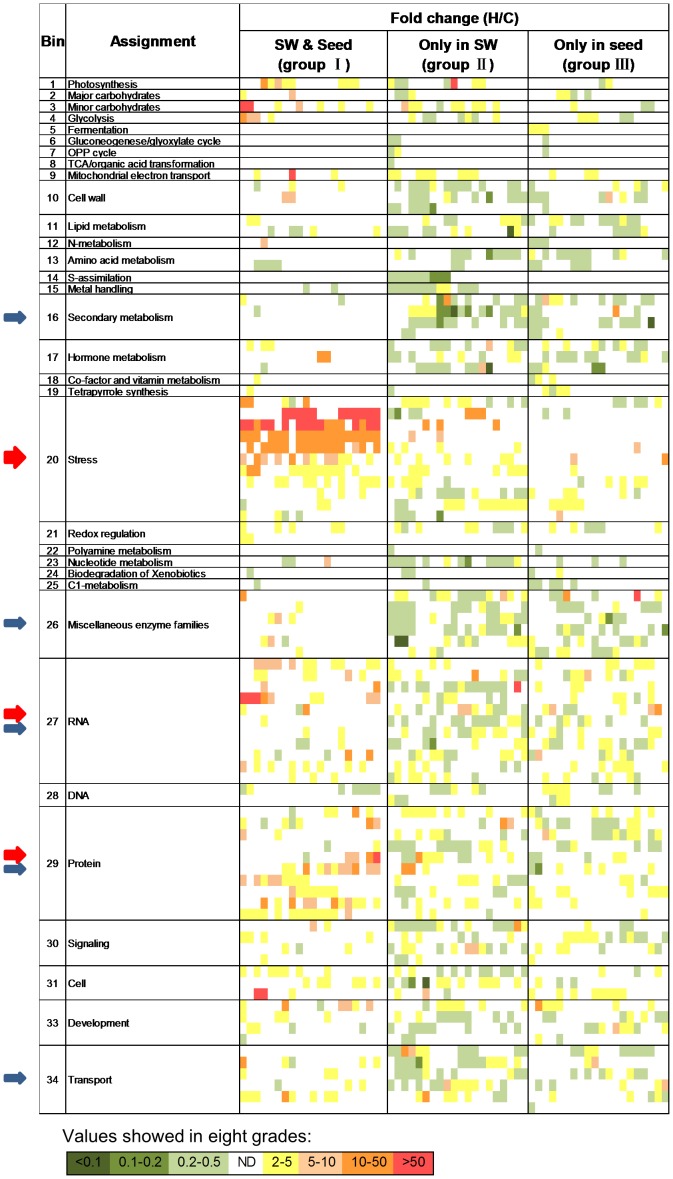
Figure 2. Heat map of the differentially expressed genes in 34 functional categories.
Fold change was expressed as the ratio of normalized expression of heat to control, and the value was divided into eight grades as shown in the diagram. ND designates no differentially expressed unique genes. Arrows in red/blue highlight the categories with abundant up-regulated/down-regulated genes. The width of the arrow is proportional to the number of up-regulated/down-regulated genes. The corresponding genes in groups I/II/III of the heat map are listed in Table S2.

