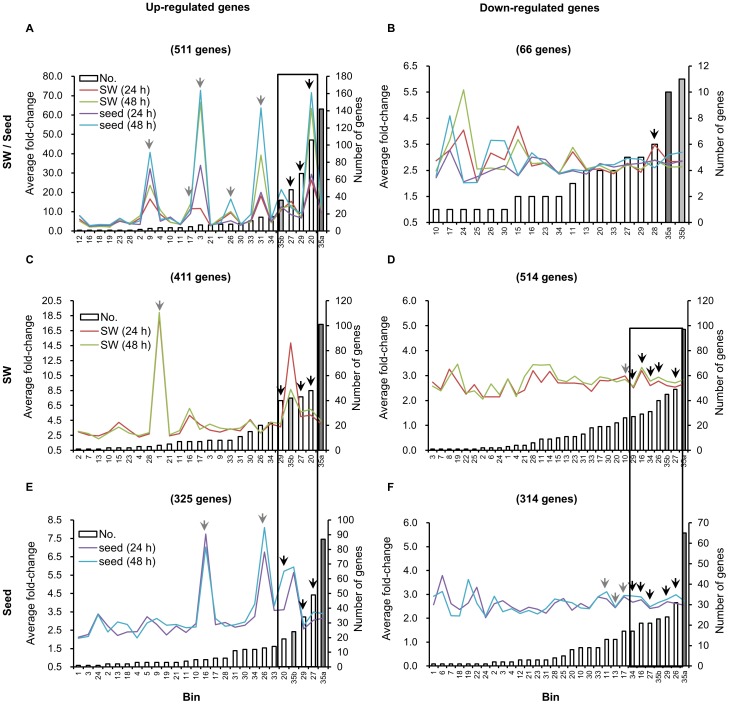
Figure 3. Statistical analysis of functional classifications for differentially expressed genes with different patterns.
A-F show the average fold-change and abundance in different functional categories of up-regulated genes in group I (A), group II (C) and group III (E) and the same parameters for the down-regulated genes in group I (B), group II (D) and group III (F). Dark-gray and light-gray bars represent the genes with unknown functions that were conserved (Bin 35a) and not conserved (Bin 35b), respectively, with Arabidopsis. Arrows in black indicate the important functional categories that had the most abundant genes (usually with large alterations); arrows in gray indicate the important functional categories that had less abundant genes but usually contained genes that had been dramatically altered or abundant moderately altered genes. The two large open boxes in A-F indicate the common categories in corresponding samples.

