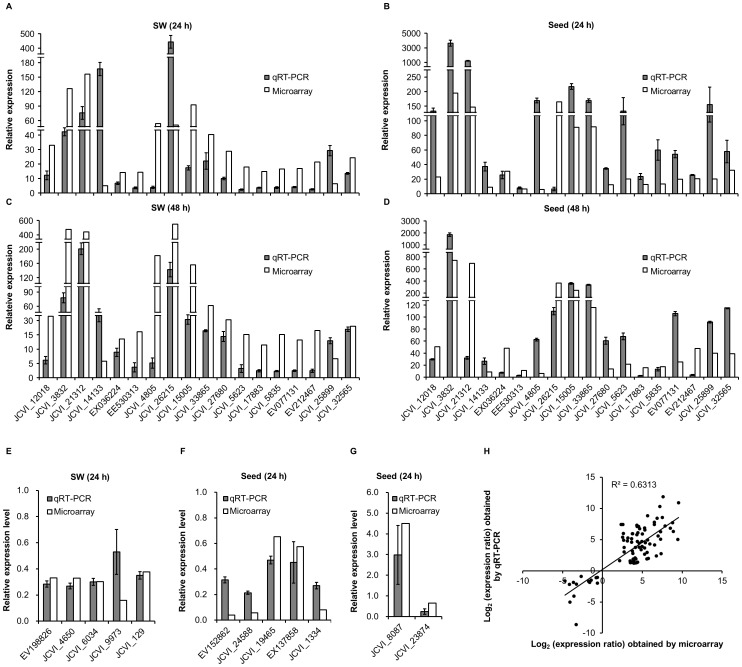
Figure 7. qRT-PCR validation of differential expression.
Relative expression levels of 18 up-regulated genes were detected in the SW and seeds sampled at 24 h (A and B) and 48 h (C and D) after heat treatment. 10 down-regulated genes, of which 5 involving glucosinolate metabolism and another 5 associated with flavonoid synthesis were analyzed in the SW (E) and seeds (F) at 24 h after treatment respectively. Two genes may responsible for lipid synthesis were also detected in seeds (G). (H) Correlation of the gene expression ratios obtained from qRT-PCR and microarray data. The qRT-PCR log2 value of the expression ratio (y-axis) has been plotted against the value from the microarray (x-axis). The results of all the tested genes were listed in detail in Table S9. Data were collected from three biological replicates and three technical replicates for each sample.

