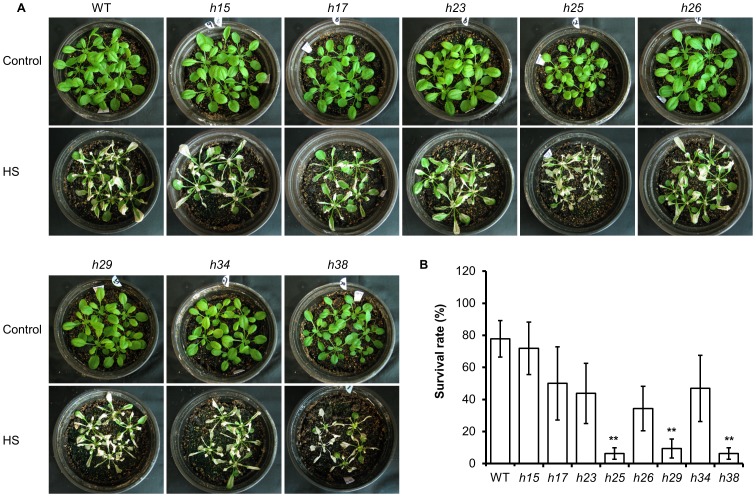
Figure 9. Heat stress tolerance of soil-based plants during continuous heat treatment.
(A) Plants under control and heat stress (HS) conditions are shown in parallel. (B) Survival rates of mutant lines after continuous heat treatment. Data were collected at 3 weeks after heat stress in A from three independent replicates. ** indicates a significant difference compared with WT plants for P<0.01 based on a t-test.

