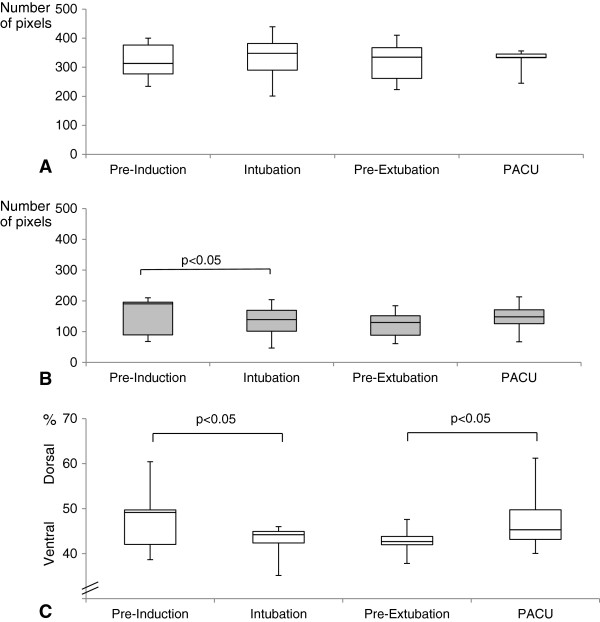
Figure 3.

Tidal volume distribution throughout major open upper abdominal surgery. A) Total ventilated lung area, B) Dorsal ventilated lung area C) Center of ventilation index. Boxplots display median, interquartile range, minimum and maximum values. Statistically significant differences are indicated. “Pre-Induction” = spontaneous breathing prior to anesthesia induction, “Intubation” = mechanical ventilation shortly after intubation, “Pre-Extubation” = mechanical ventilation at the end of surgery shortly prior to extubation, PACU=“Postanesthesia care unit”, spontaneous breathing after extubation. Analysis of tidal volume distribution at “Intubation” was not possible in three patients due to insufficient skin contact with more than one electrode, thus measurement of 11 patients were available at this time point. “PACU” measurements were unavailable from four patients who remained on mechanical ventilation and were considered invalid in one additional case, resulting in data from 9 patients.
