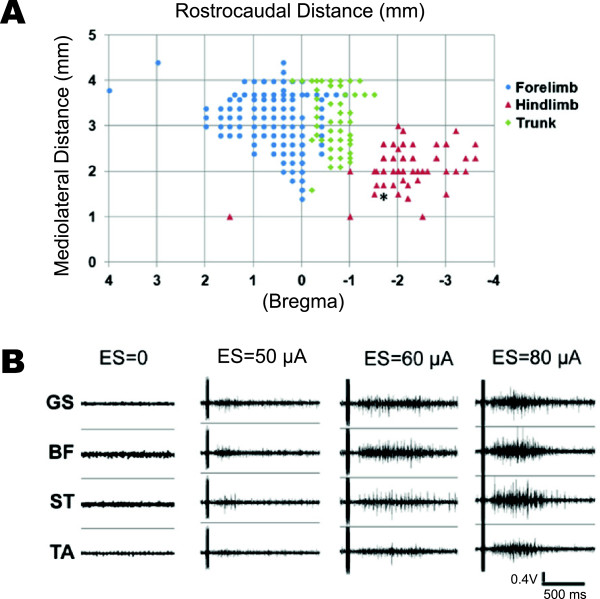
Figure 3.

M1 mapping in anesthetized guinea pigs. A. Forelimb, trunk, and hindlimb representations. Star: stimulation site of panel B. B. EMG signals of four hindlimb muscles stimulated by varied currents (0–80 μA). ES: electrical stimulation, GS: gluteus superficialis, BF: biceps femoris, ST: semitendinosus, TA: tibialis anterior.
