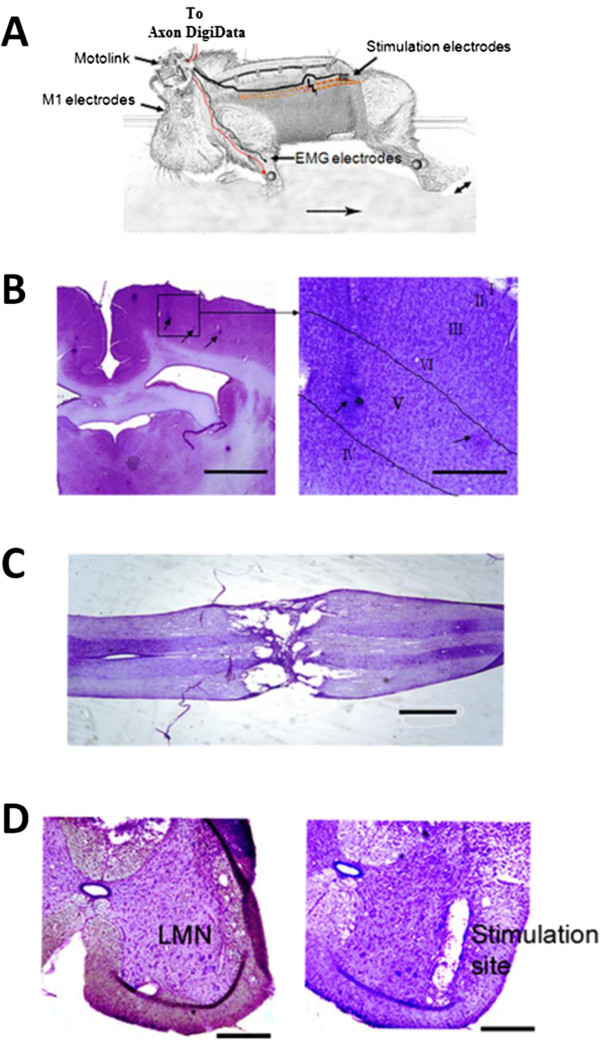
Figure 7.

Recording and stimulating sites. A. Schematic drawing of experimental set-up. Triggered movement of the left hindlimb is indicated by a double-headed arrow. B. Recording sites in layer V of the M1. Left: Recording electrode traces (arrows). Scale bar = 1 mm. Right: Higher magnification of electrode traces. Scale bar = 200 μm. C. Spinal cord lesion 21 days after transection. Scale bar = 1 mm. D. Left: LMNs in the ventral horn of the spinal cord at L3 level. Right: Stimulating electrode trace in the spinal cord. Scale bar = 200 μm.
