Figure 3.

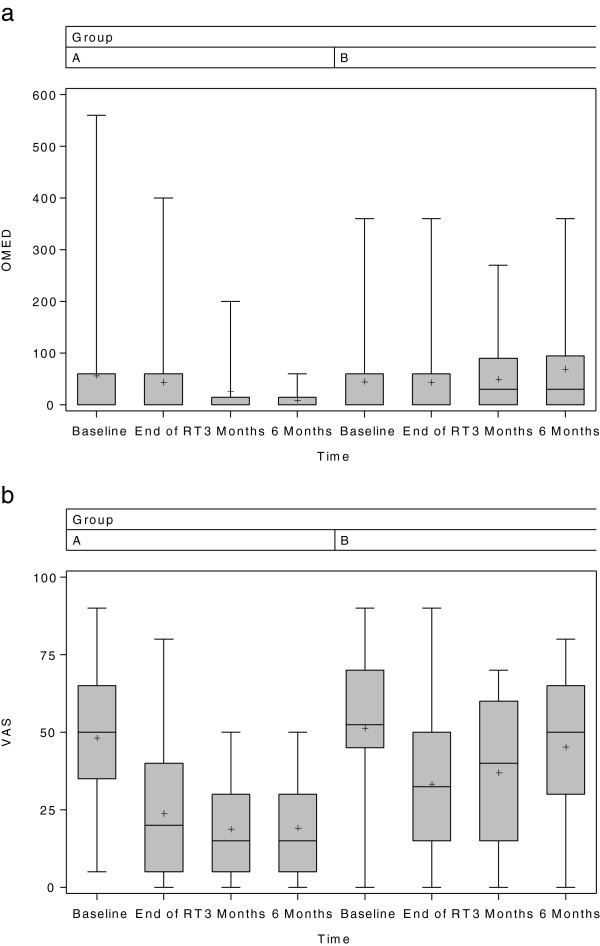
OMED and VAS of both groups at measured points. a. OMED of both groups at measured points (T0, T1, T2, T3). b. VAS of both groups at measured points (T0, T1, T2, T3).

OMED and VAS of both groups at measured points. a. OMED of both groups at measured points (T0, T1, T2, T3). b. VAS of both groups at measured points (T0, T1, T2, T3).