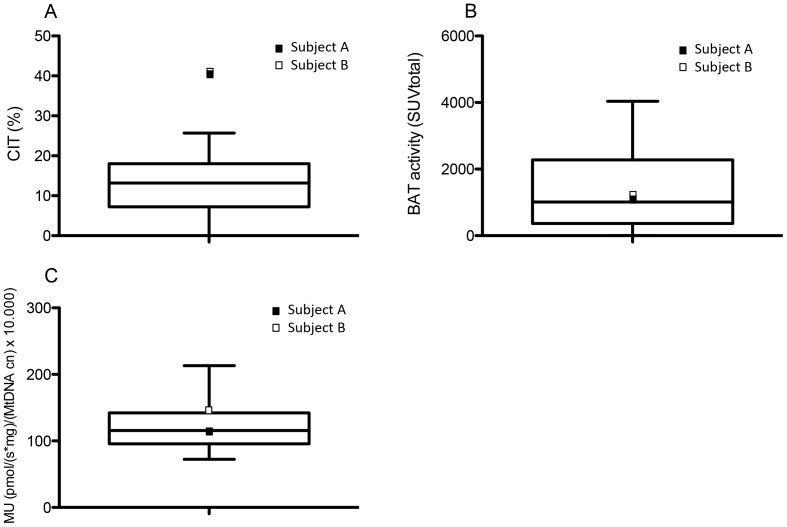
Figure 3. Comparison of CIT, BAT activity and skeletal muscle intrinsic mitochondrial uncoupling between the monozygotic twin and young adult men.
Boxplots indicating the median and interquartile range of CIT (A) and BAT activity (B) found in young adult men during previous studies [6], [17], [18], [29] (CIT n = 43; BAT activity n = 45). C) Boxplot showing the skeletal muscle mitochondrial proton leak in young adult men (n = 30) from a previous study (n = 8) and unpublished results (n = 22). In each boxplot subject A is indicated as a black square and subject B as an open square. The whisker bars represent the 5th (lower) and 95th (upper) percentile.

