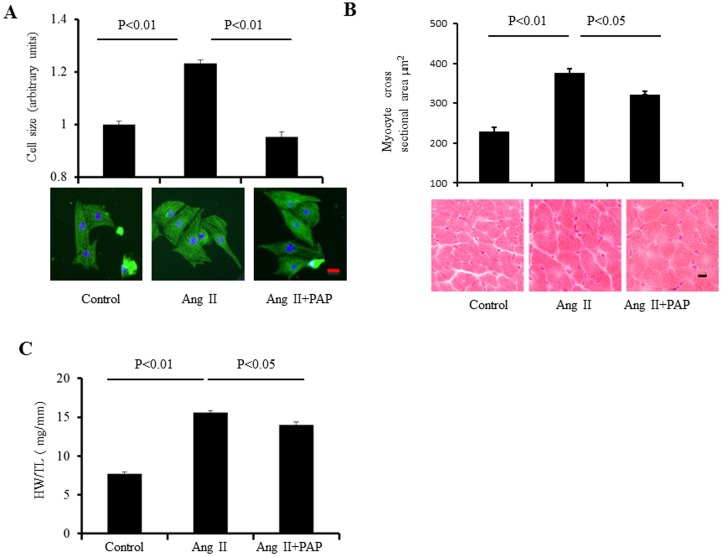
Figure 2. PAP abrogates Ang-II induced hypertrophy in in vitro and in vivo models.
A: NRVMs were treated with Ang II (500 nM) with or without co-treatment of PAP (20 µg/ml) for 48 h, followed by α-actinin immunostaining. Cell size was measured and presented as the bar graphs (upper panel, 450 cells from three independent experiments). Representative images of double staining of NRVMs are shown in lower panel (green staining for α-actin; blue for DAPI, scale bar: 20 µm). B: Mean of cross-sectional areas measurements (upper panel); HE staining of heart cross-sections (lower panel, scale bar: 20 µm, n = 4). C: HW/TL ratios of mice before and after Ang II or Ang II+PAP treatments (n = 4).

