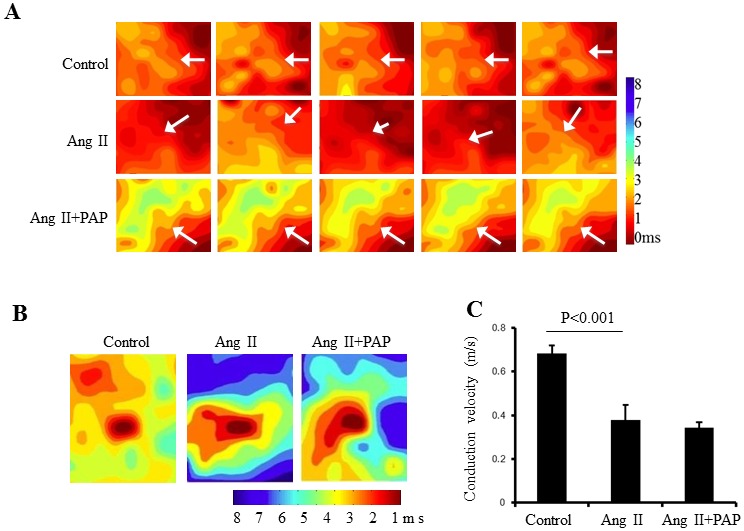
Figure 4. Ventricular epicardial electrical mapping with a multi-electrode array (MEA).

A: Representative activation maps of five successive cardiac cycles under sinus rhythm obtained from the hearts from the control group and Ang II+PAP group showed a general pattern of sequential activation, whereas the hearts from Ang II group often showed a disordered pattern with beat-to-beat variations (n = 6), inserted arrows indicate the conduction direction. B: Pacing induced activation maps generated by pacing in the center of array on the epicardium of left ventricle from mice without any treatment and treated with Ang II or Ang II + PAP (n = 6 for each group). C: Comparison of left ventricular conduction velocity (n = 6 for each group).
