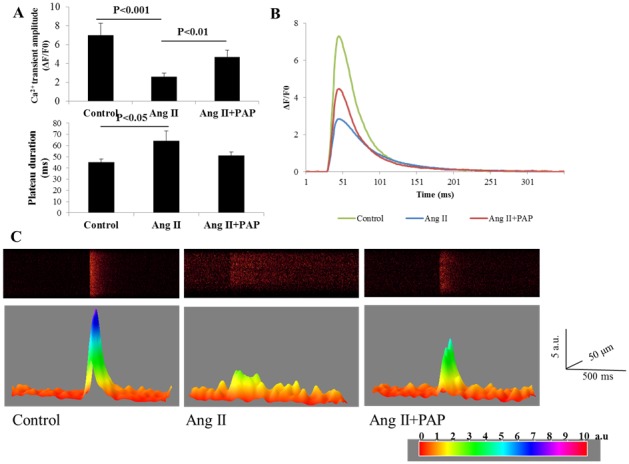
Figure 8. PAP restored the Ang II induced reduction of amplitudes and prolongation in peak-plateau of calcium transients in ventricular myocytes.

A: The amplitude of the peak of calcium transients (upper panel) was measured by ΔF/F0. The duration of peak-plateau phase of the calcium transients (lower panel) was measured as the time interval between the upstroke of the fluorescence signal (measured at 80% of the maximum value) and the corresponding point on the decay (also measured at 80% of the maximum value). Both were presented as mean ± S.E.M (Control: n = 14; Ang II: n = 18; Ang II+PAP: n = 11). B: The representative traces showing the calcium transients of each group. C: The 2D and 3D representative images showing calcium transients.
