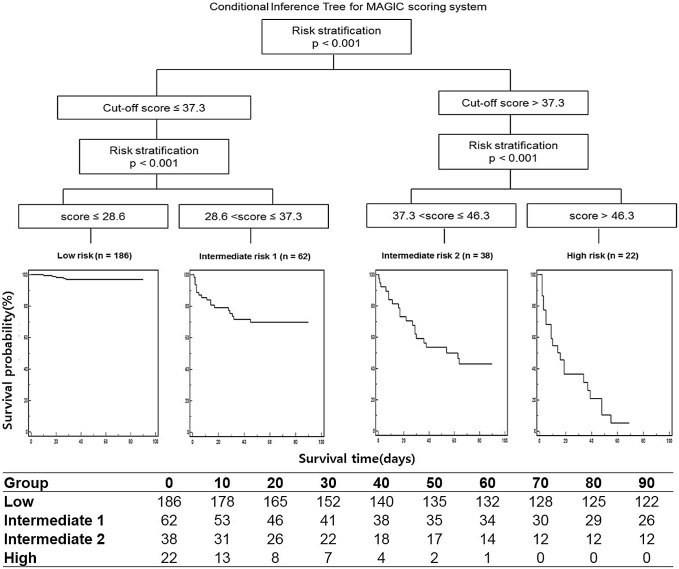
Figure 2. Risk stratification of liver-related death according to the cumulative survival probabilities in the derivation cohort.
We analyzed survival data using conditional inference trees to stratify a derivation cohort into four risk groups and to determine the optimal cutoff scores of MAGIC. The X-axis indicates the survival time (days), and the Y-axis indicates the survival probability (%). MAGIC, model for alcoholic hepatitis to grade the severity in an Asian patient cohort.

