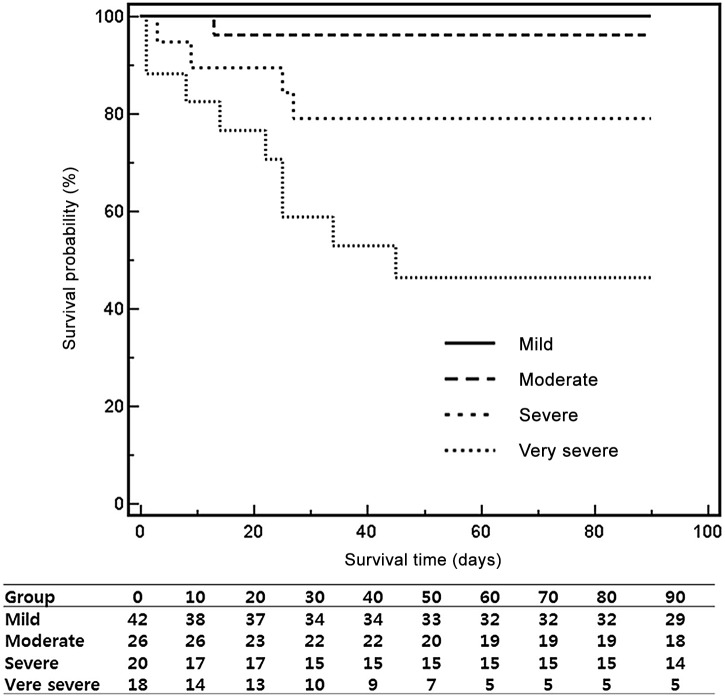
Figure 3. Validation of the optimal cutoff scores of MAGIC for individual risk groups of liver-related death in the validation cohort.
The X-axis indicates the survival time (days), and the Y-axis indicates the survival probability (%). The solid line represents the mild-risk group (≤29, n = 42), the dashed line represents the moderate-risk group (29<risk score≤37, n = 26), the large dotted line represents the severe-risk group (37<risk score≤46, n = 20), and the small dotted line represents the very severe-risk group (>46, n = 18). MAGIC, model for alcoholic hepatitis to grade the severity in an Asian patient cohort.

