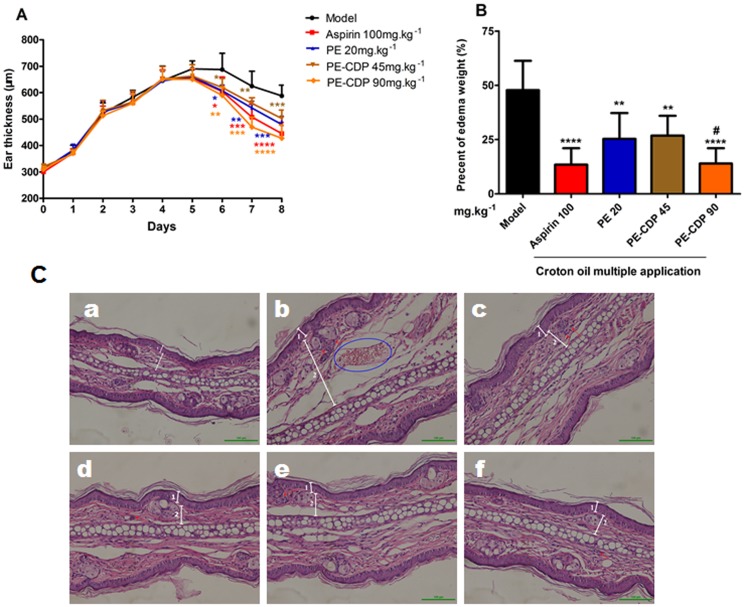
Figure 5. Effect of PE-CDP on croton oil multiple application-induced ear edema.
(A) shows the time response curve of the effect from days 0 to 8. Croton oil in acetone was applied on days 0–4. The thickness of the ear was measured daily, using a digital caliper. On days 5–8, the ear of the animals received a 0.5% CMC aqueous solution, aspirin, PE or PE-CDP. (B) shows the percentage of edema weight for each group on day 8. *P<0.05, **P<0.01, ***P<0.001 and ****P<0.0001 compared to the 0.5% CMC aqueous solution-treated group, #P<0.05 compared to the PE 20 mg•kg−1•d−1 group (n = 8). C Histological examinations of mice sensitized with multiple applications of croton oil, stained with hematoxylin–eosin and examined under light microscopy. Treatments: non-inflamed (a), inflamed ear (b), aspirin: 100 mg•kg−1•d−1 (c), PE 20 mg•kg−1•d−1 (d), PE-CDP 45 mg•kg−1•d−1 (e) and PE-CDP 90 mg•kg−1•d−1 (f). The numbers 1 and 2 indicate the epidermis and dermis, respectively. The arrows indicate inflammatory cells in the dermis. The blue areas indicate red cells.

