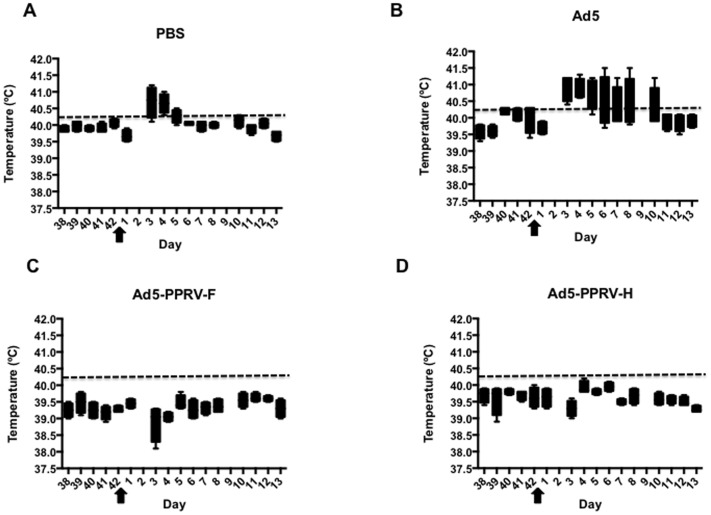
Figure 5. Rectal temperature in vaccinated and non-vaccinated animal groups upon PPRV challenge.
The minimum to maximum values of temperatures from day 38 of the experiment to day 13 pc for each experimental group is represented in a box and whiskers plot. Each panel corresponds to each group of animals, as indicated. Arrows indicate the day of PPRV challenge. The dashed line in each panel indicates the threshold temperature value above which animals were considered to have fever.

