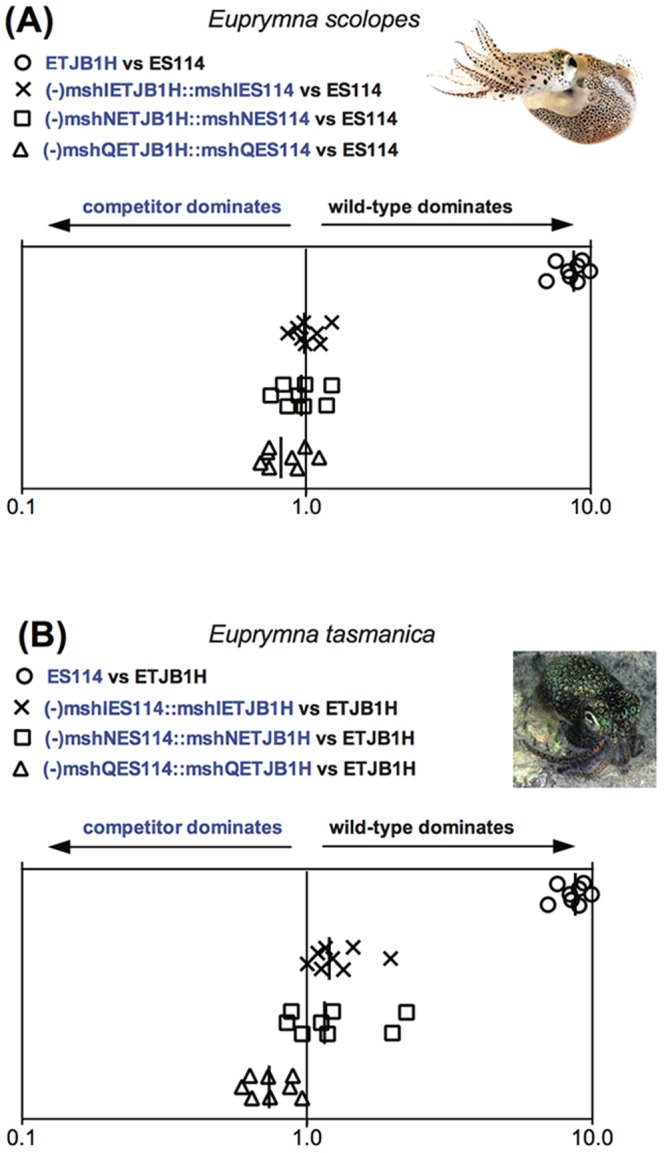
Figure 2. msh operon data.

Colonization assays 48-hour post-infection of juvenile (A) Euprymna scolopes and (B) Euprymna tasmanica by their respective wild-type (ES114 or ETJB1H), mutant, and complement strains of msh genes for Vibrio fischeri. Infection efficiency data is plotted as the log values of the relative competitiveness index (RCIs), calculated by dividing the ratio of mutant to wild-type by the starting ratio [28]. If the RCI is <1 the mutant strain was outcompeted by the wild-type, the wild-type strain was outcompeted by the mutant if the value is >1, and a RCI equal to 1 indicates no competitive difference. Data points represent individual animals and the position of the figures on the y axis is merely for spacing. Vertical line represents the median value of each data plot.
