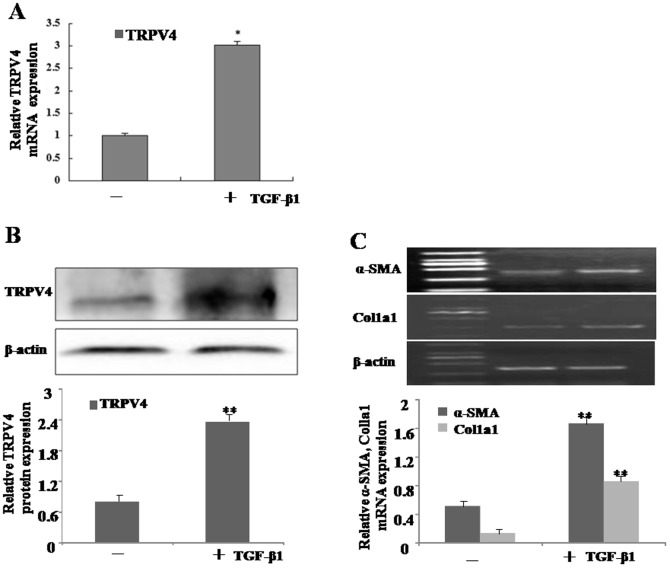
Figure 2. Increasing expression of TRPV4 mRNA and protein during HSC activation.
A. Total RNAs were isolated from TGF-β1-treated HSC-T6 cells, and subjected to qRT-PCR analyses. Representative images of three independent experiments are shown. *p<0.05 vs. non-treated cells. B. Whole-cell extracts were isolated from TGF-β1-treated HSC-T6 cells, and subjected to Western blot analyses with TRPV4 and β-actin antibodies. Representative blots of three independent experiments are shown. **p<0.01 vs. non-treated cells. C. Total RNAs were isolated from TGF-β1 treated HSC-T6 cells at different time points. The expression of α-SMA and Col1a1 mRNA was assessed by RT-PCR. Representative images of three independent experiments are shown. **p<0.01 vs. non-treated cells.

