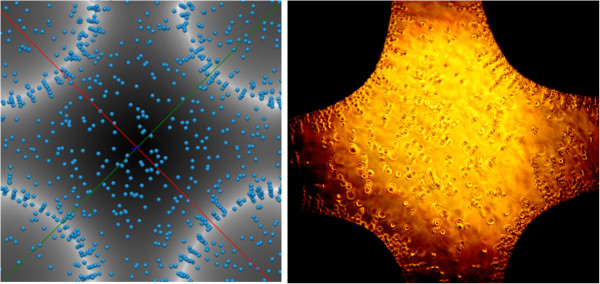
Figure 4.

left) Top view of the final spatial distribution of the Monte Carlo simulation (same of Figure 2) with superimposed the intensity map of (same as Figure 2,right). The association between dipole chains and high regions of electric field is evident. Right) Top view of experimental spatial distribution of MDA-MB-231 after 180 sec of DEP manipulation. Black areas are associated to the metal electrodes. The chains are clearly present all around the electrodes.
