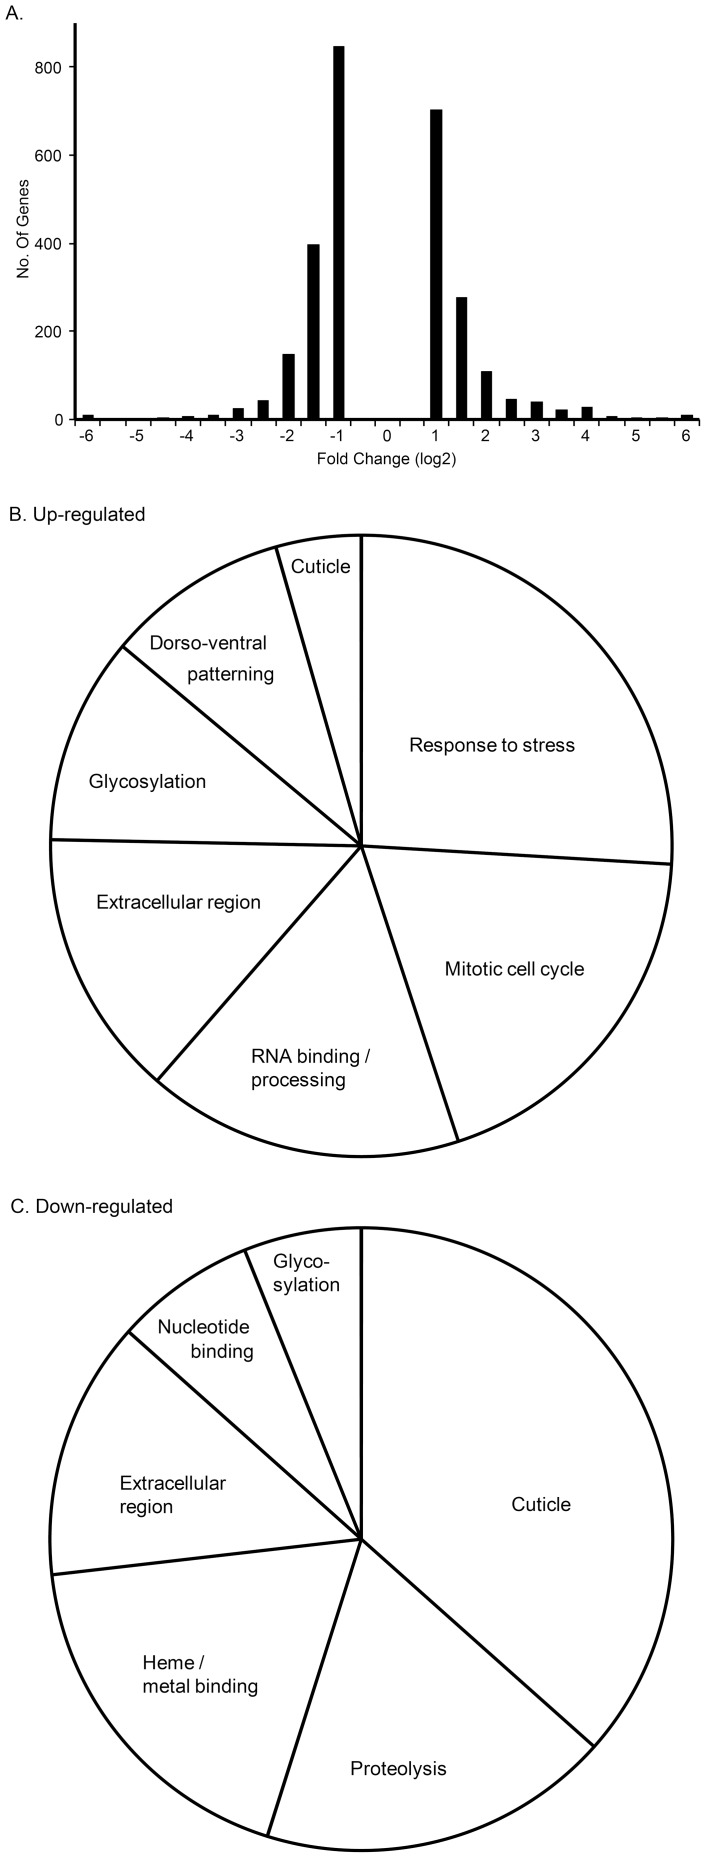
Figure 2. Analysis of RNA-Seq differential expression between wild-type control and heph03429 mutant. A.
Histogram depicting fold-change values (above two-fold) of all genes that are significantly changed. B and C. Most overrepresented (four-fold and above up-regulated or down-regulated) gene ontology categories from the DAVID analysis are shown by their percent representation in terms of number of genes. Many genes belong to multiple categories.

