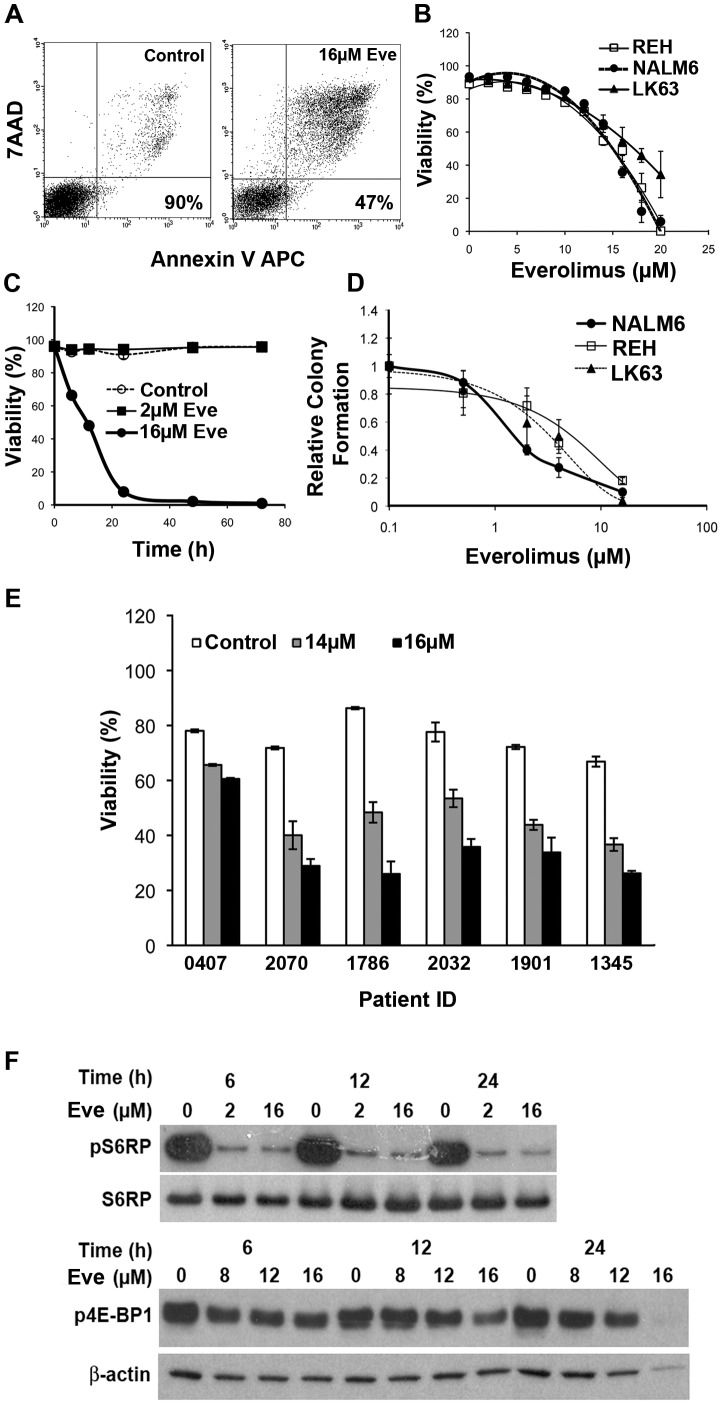
Figure 1. Everolimus induces a dose dependent cell death in ALL cell lines and patient samples.
(A) Representative dot plots showing the staining with Annexin V and 7AAD on ALL cells treated with vehicle, or 16 µM everolimus for 24 h with the viability indicated on the plots. (B) Dose response curves for ALL cells lines following a 24 h exposure to the indicated concentrations of everolimus. (C) The viability of NALM6 cells treated with everolimus for the indicated time periods. (D) Clonogenic potential of the indicated ALL cell lines following overnight exposure to the indicated concentrations of everolimus. Data has been normalized to control cultures. (E) The effect of a 24 h exposure to the indicated concentrations of everolimus 1 on the viability of patient ALL samples. (F) Western blots showing the phosphorylation of S6RP and 4E-BP1 in NALM6 cells following treatment with indicated concentrations of everolimus over various time intervals.

