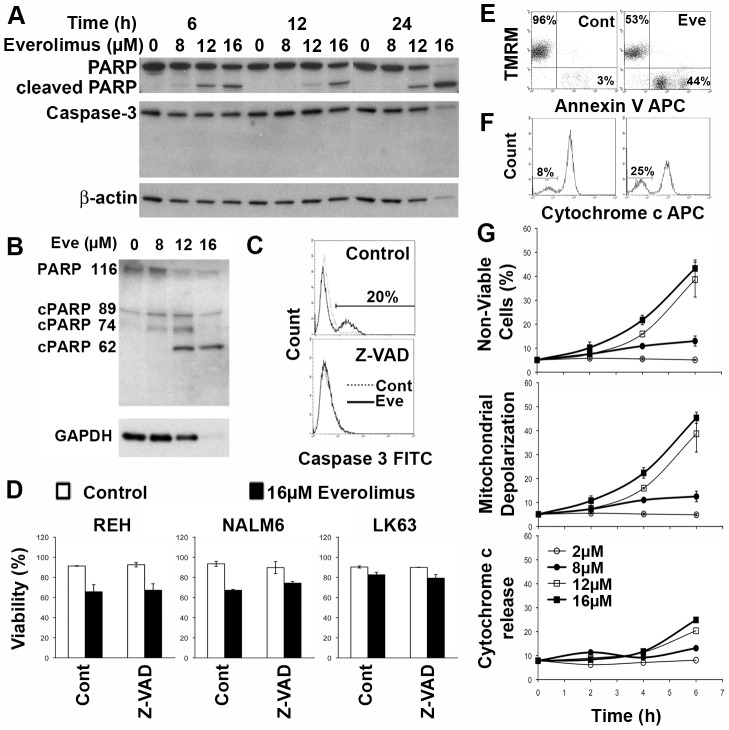
Figure 2. Everolimus induces a caspase independent cell death in ALL cells.
(A) NALM6 cells were treated with indicated concentrations of everolimus for the specified time intervals and cell lysates prepared. Western blots for PARP and caspase 3 are shown with b-actin acting as a loading control. (B) NALM6 cells were treated with indicated concentrations of everolimus for 24 h and cell lysates prepared. Western blots for PARP using the C2-10 antibody are shown with b-actin acting as a loading control. (C) NALM6 cells were pretreated with Z-VAD (right panel) or vehicle (left panel) and then exposed to 16 µM everolimus or placebo for 24 hours. Cells were stained for activated caspase 3 and analyzed by flow cytometry and overlay histograms of placebo and everolimus treated cells is shown. (D) The indicated cell lines were treated as in (B) were labeled with Annexin V and 7AAD and analysed by flow cytometry. The percentage of viable cells (dual negative cells) has been plotted. (E) NALM6 cells were treated with placebo or 16 µM everolimus for 6 hours and then stained using TMRM and annexin V. Representative flow plots are shown. The percentage of TMRM positive/annexin V negative and TMRM negative/annexin V positive cells are shown in the upper left and lower right quadrants respectively. (F) Cells treated as in D were stained for cytochrome c. The percentage of cells negative for cytochrome c is shown. (G) NALM6 cells treated as above for the indicated time periods with the specified concentrations of everolimus were assessed by flow cytometry for viability (upper panel), mitochondrial depolarization (middle panel) or cytochrome c release (lower panel) by flow cytometry as described for C, D and E respectively.

